
Another Mostly Good Jobs Report
A blemish or two from the household survey, but all in, the US job market is shrugging off a lot of bad policy. Also, breakevens and a PSA re a new Substack from Justin W.

With another solid jobs report—that makes two in a row—the U.S. labor market just kept tickin’ last month, largely shrugging off war-induced inflation, AI threats to jobs, and the uncertainty that’s long prevailed given Trumpian chaos.
Payrolls rose 115,000 last month, well above expectations for 65,000, and the unemployment rate held at 4.3%, though it just missed a tick-up, rising to 4.34% from from 4.26% (the household survey, from which the jobless rate is drawn, came in softer than the payroll survey; it’s not unusual for them to disagree in any given month).
Revisions to payroll gains over the prior two months subtracted 16,000 jobs from Feb/Mar such that the three-month average gain is 48,000. That’s just about spot on the breakeven rate estimate I feature below—the number of monthly jobs needed to stabilize the unemployment rate. Yes, that number is clearly lower than the average gains we were posting back in the Biden years, but because labor force growth has significantly slowed, we don’t need as many jobs now to hit breakeven.
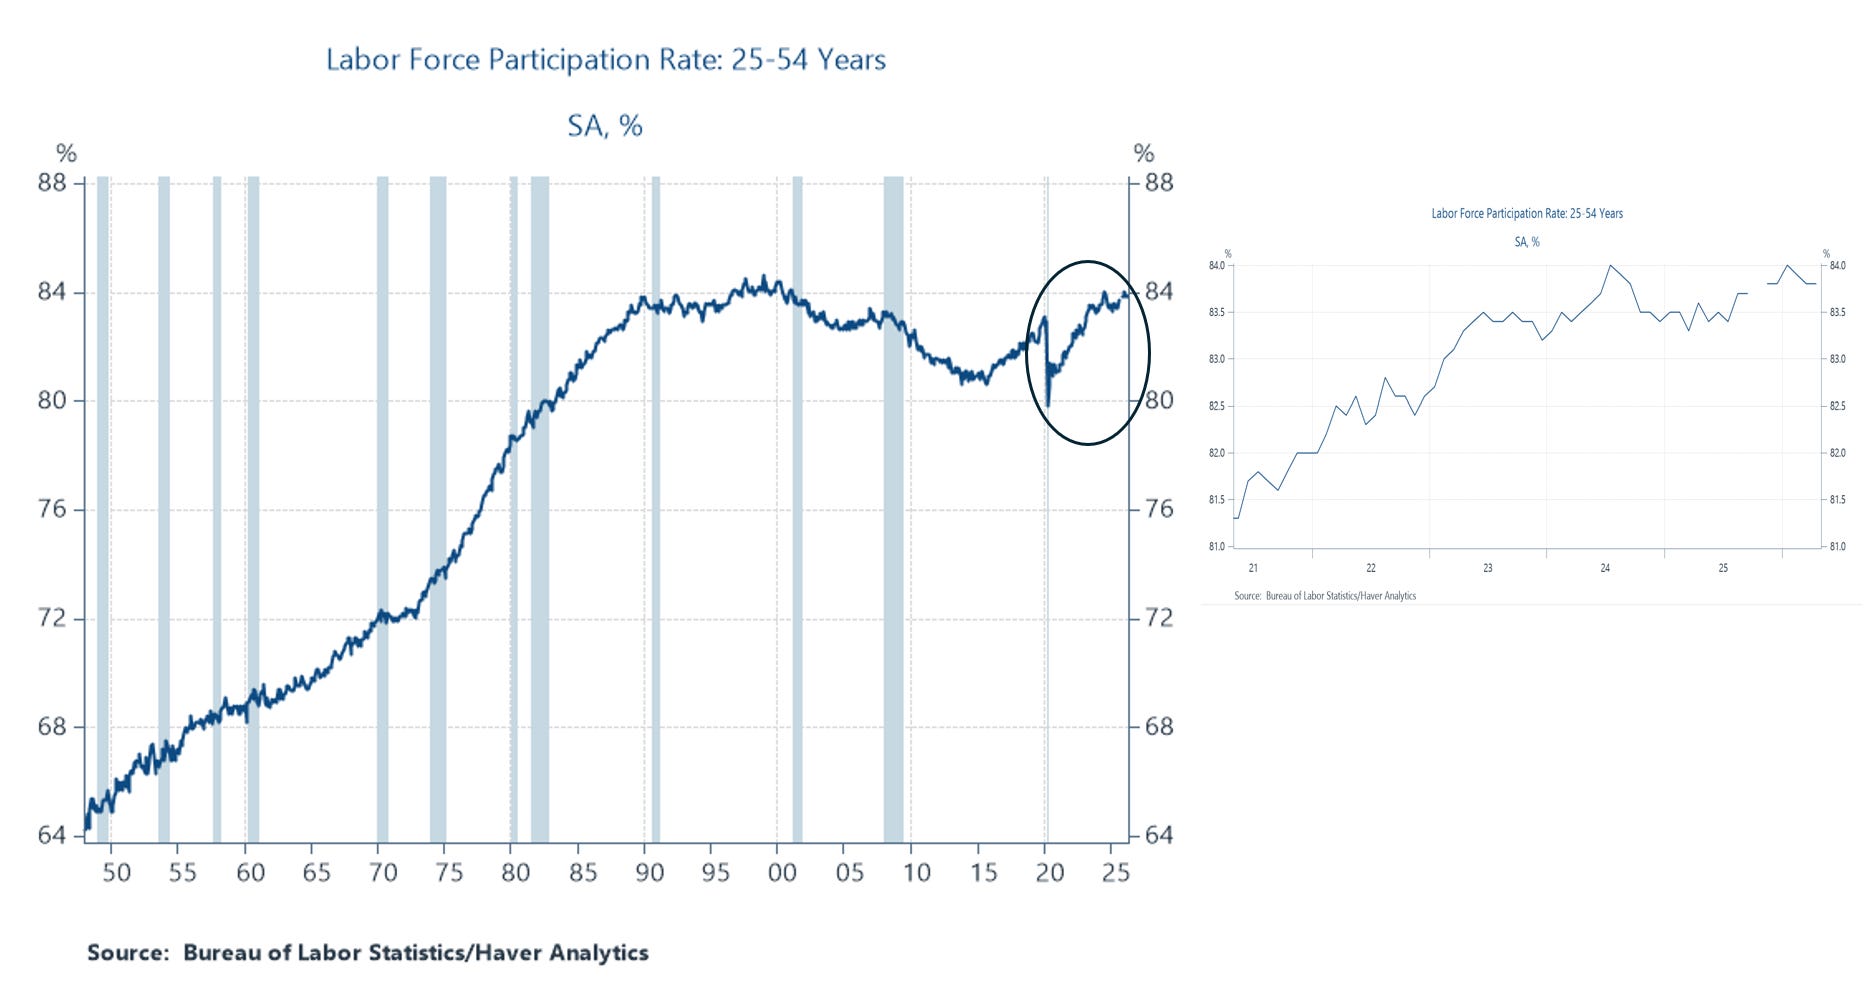
While the growth of labor supply has slowed, labor force participation for so-called prime-age workers (25-54), a good metric for the health of the job market, remains elevated, and is near its historical ceiling.
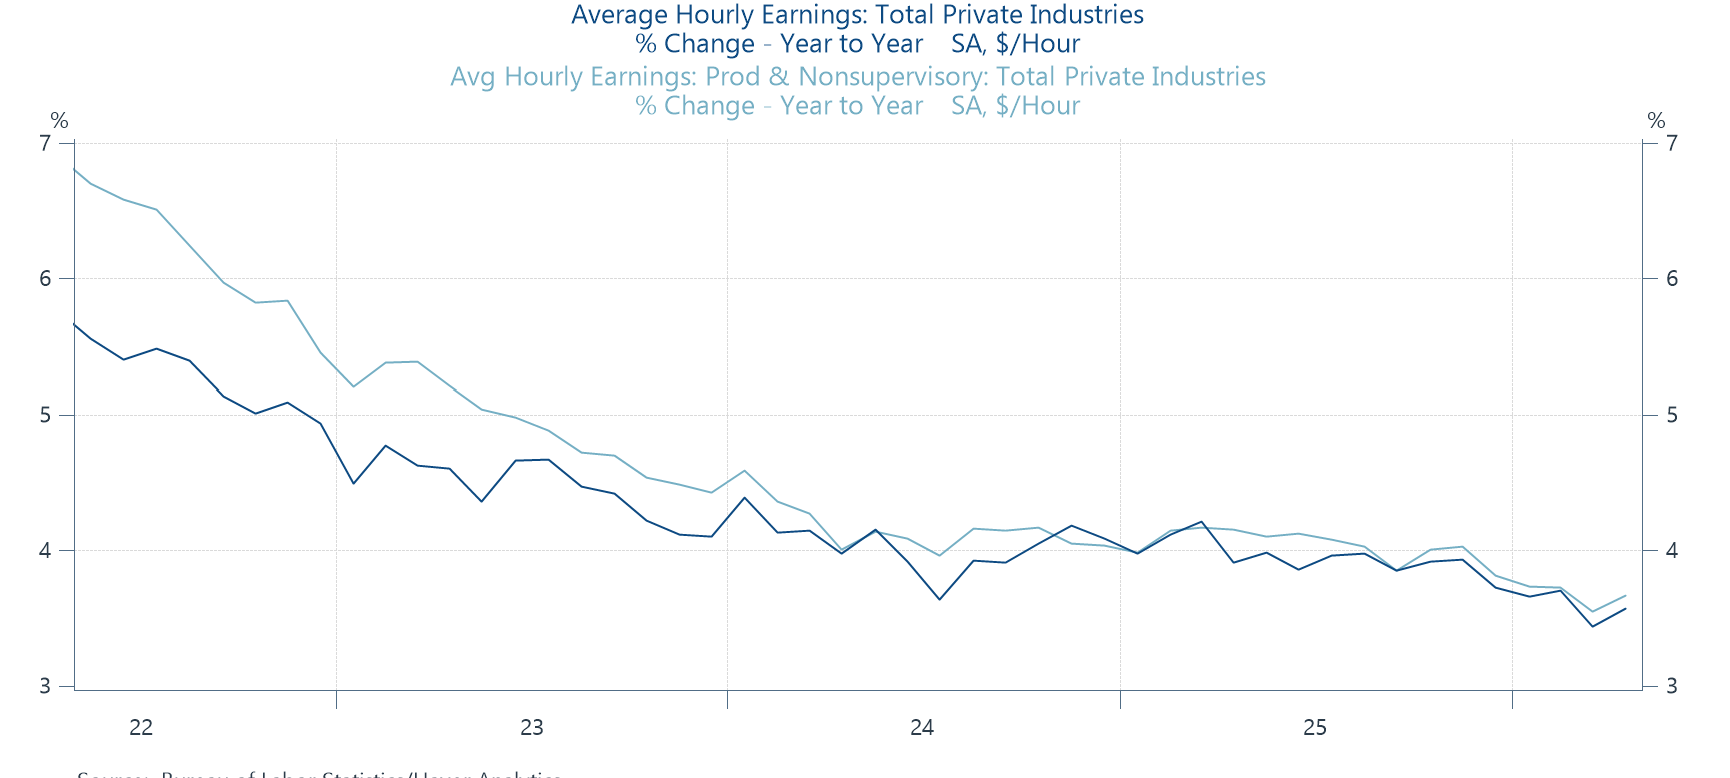
In other sign of sustained labor demand, nominal wage growth ticked up slightly for both all private-sector workers and for mid-wage workers (production, non-supervisory). Still, while we don’t know May’s inflation rate, with the war-induced pressure, it will very likely be close to the 3.6%/3.7% rate for all/mid-wage workers shown below, meaning their paychecks’ buying power is much reduced.
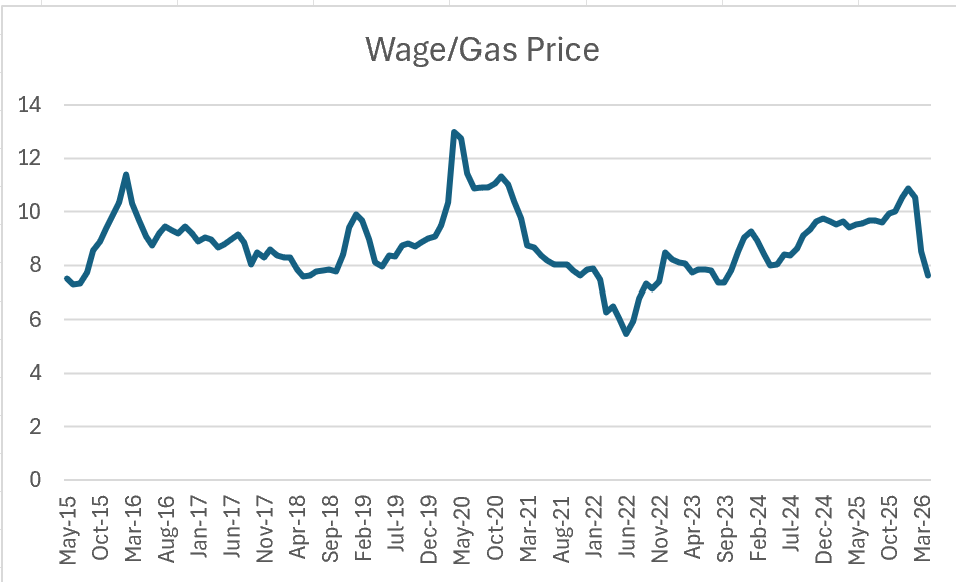
On that point, here’s the mid-level wage deflated by the gas price. It paints a clear picture of paycheck pressures on this basic need. A hour of work, on average, buys about three fewer gallons of gas than was the case prewar. Still, even with this recent spike down, this metric is back to about its pre-pandemic level.
A few under-the-hood observations:
—As noted, the household survey was pretty soft. Though the jobless rate didn’t tick up, employment fell in this survey, as did the labor force.
—Involuntary part-time work also nudged up, leading the u-6 comprehensive measure of slack to tick up from 8% to 8.2%, 40 bps above its rate a year ago.
—Federal gov’t employment continues to fall, down -9,000 last month and a whopping 348,000, over 11%, since the DOGE debacle took hold.
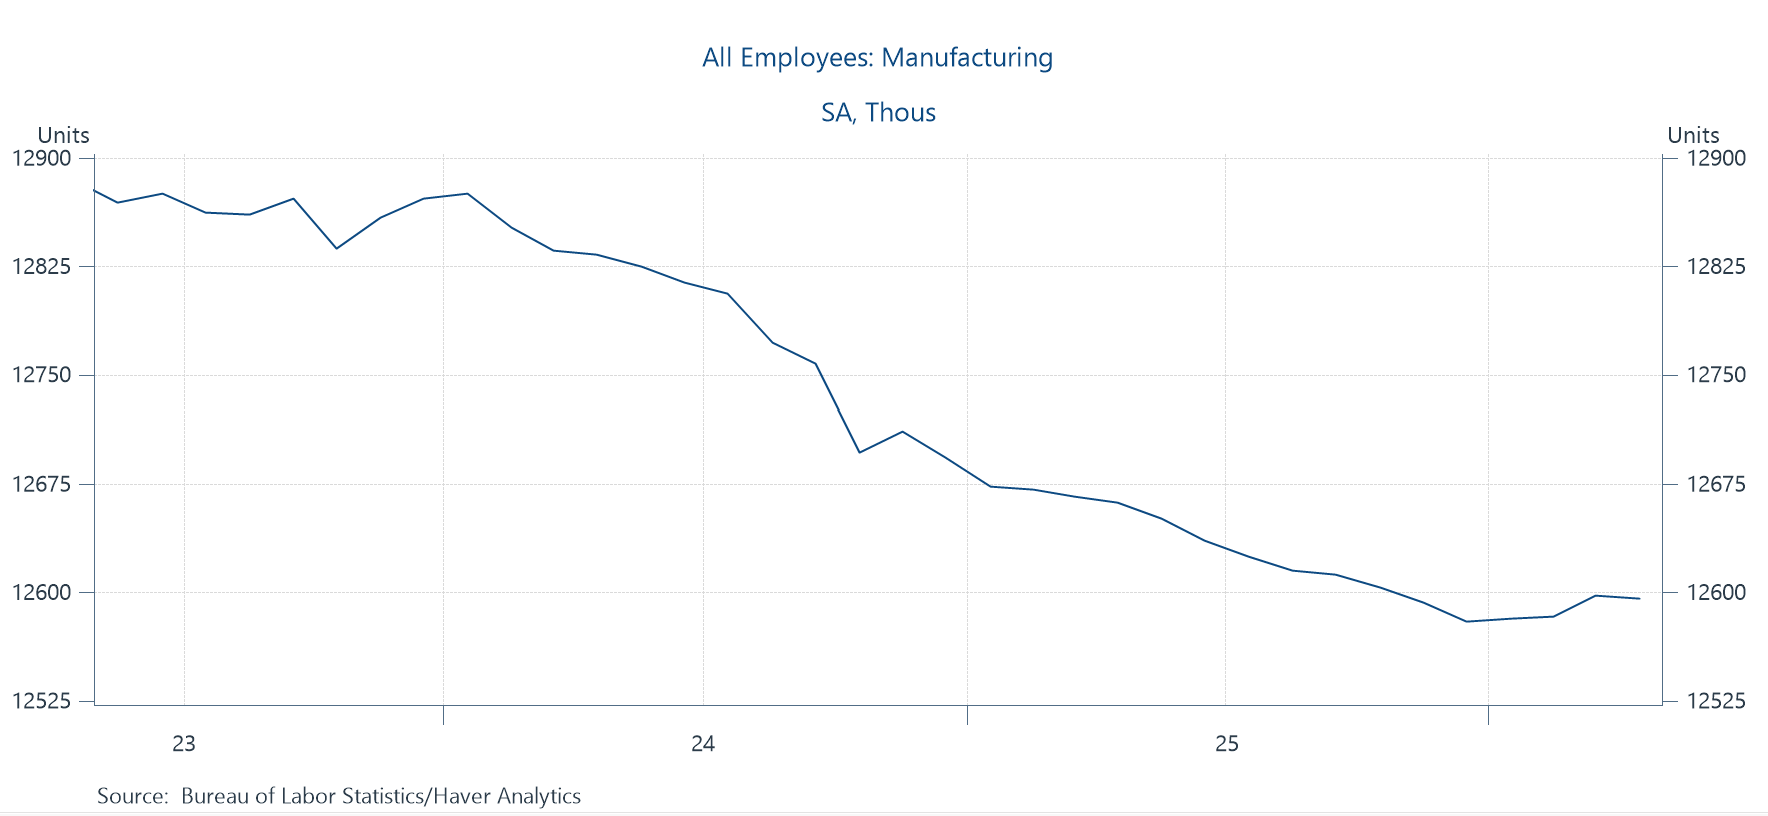
—Manufacturing continues to struggle, down 2,000 in April, 66,000 over the past year, and about 300,000 from its ‘23 peak. It appears, at least for now, to have stabilized at around 12.6 million this year, but as a share of total employment, it has been stuck at an historic low of 7.9%.
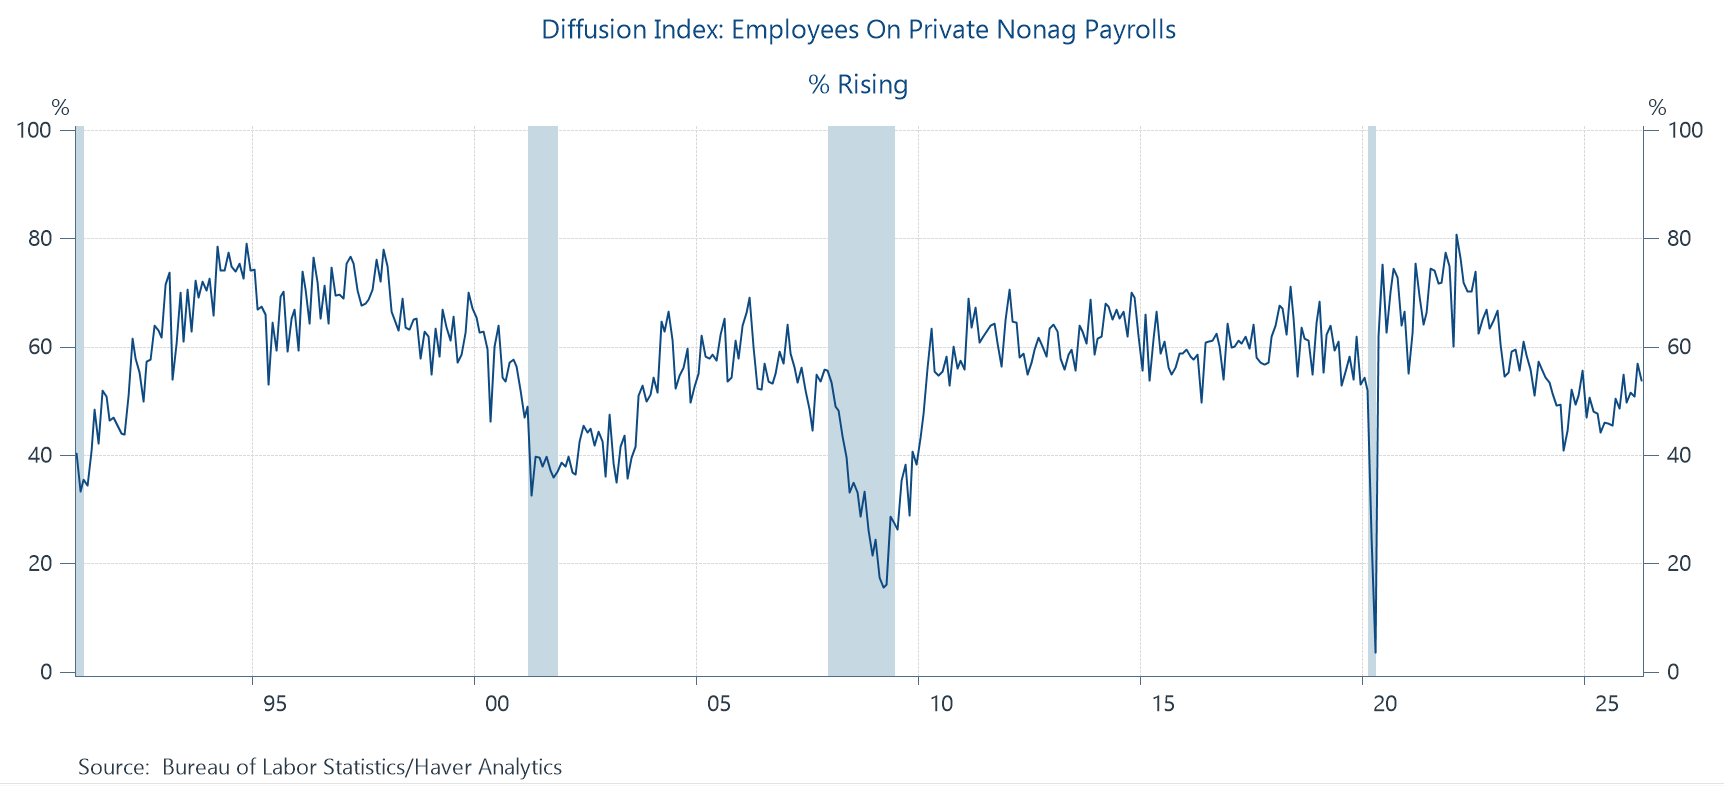
—That said, the diffusion index, which measures the share of private-sector industries adding jobs, has been looking pretty good. It’s still below its pre-pan average, but, in contrast to the claim that only the healthcare sector is adding jobs, the index is climbing back a bit.
Two last bits. First, a brief update on this important concept of breakeven rates, and second, a PSA about a new Substack from econ-explainer extraordinaire and personal pal Justin Wolfers.
What constitutes a good jobs number these days?
This is a question about the “breakeven” rate, the number of net new jobs added each month to keep the unemployment rate from rising. Imagine you’re hosting a party and you want the snack table to stay well stocked. You need to make adjustments for new folks coming into the party and other guest leaving. If you fail to add snacks when a big group of partiers enters, you’ll end up with too much labor market slack many hangry guests.
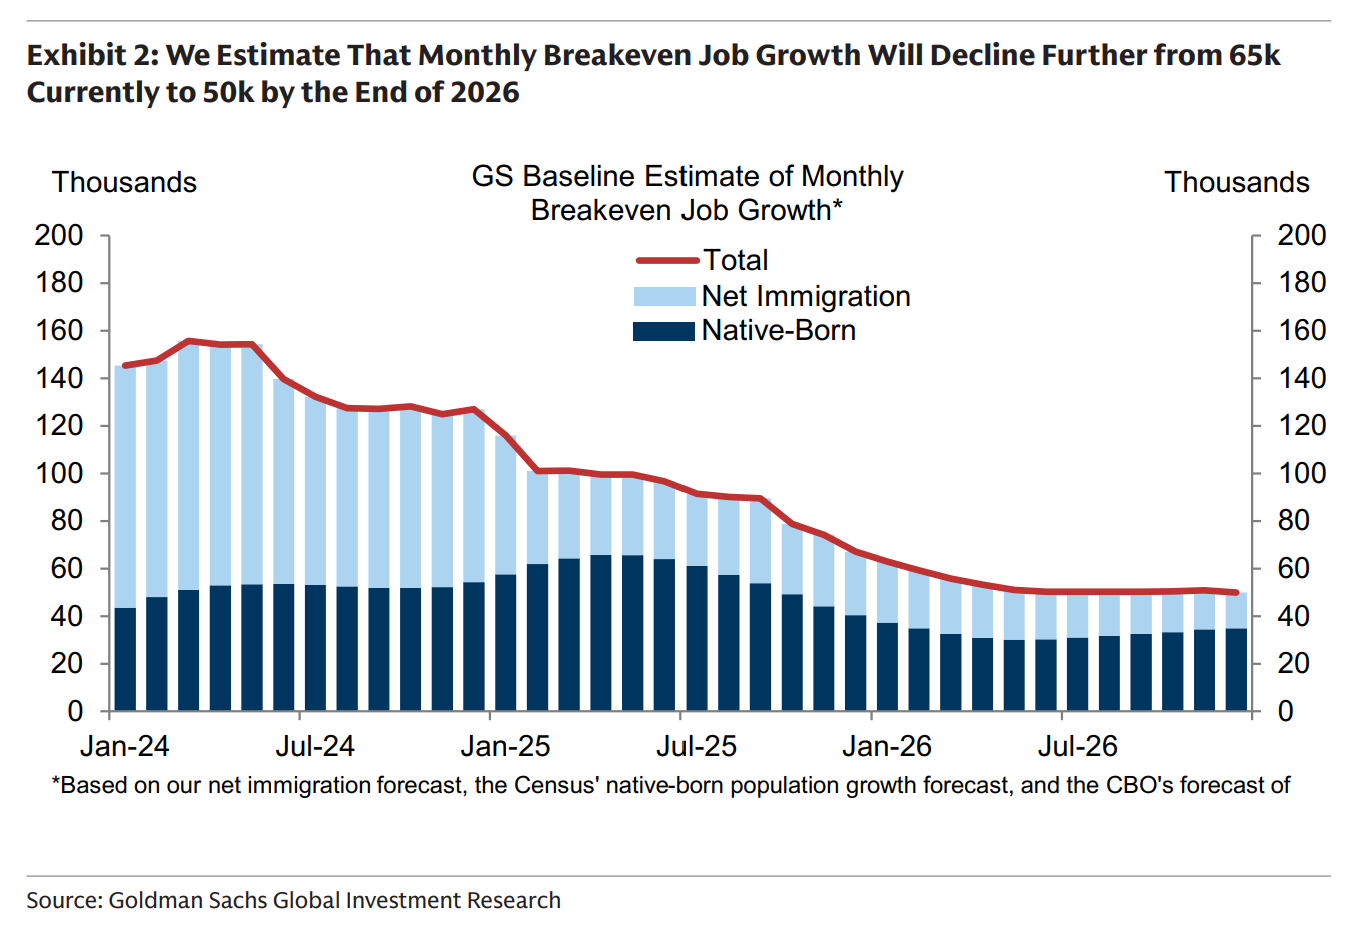
In other words, the breakeven number is in part of a function of the size and growth of the labor force, along with their participation rates. When immigration flows (of working-age persons) go up or down, that changes the breakeven, as shown in the figure below from GS. There’s been some decline in native-born workers, as aging boomers retire. But the big movements affecting the breakeven level come from changes in net immigration (entrants - exits). GS puts the current breakeven at around 50,000, which is in the upper end of current estimates, and just about April’s payroll gain. The main reason for their higher estimate is that they assume less outmigration than others.
[Hey, here’s a PSA about a new Substack by one of favorite econ explainers, Justin Wolfers. I’m sure my readers know Justin’s work, but here’s a great NYT piece on his highly successful efforts to spread the word. To me, he embodies the old adage that if you really understand something, you can explain it to anyone willing to listen. And Justin doesn’t just understand macro and micro hydraulics. He also understands the role of power in how economic outcomes are determined.]
Thanks Jared, just subscribed to Justin’s Platypus!
Didn’t an entire airline just go under?