

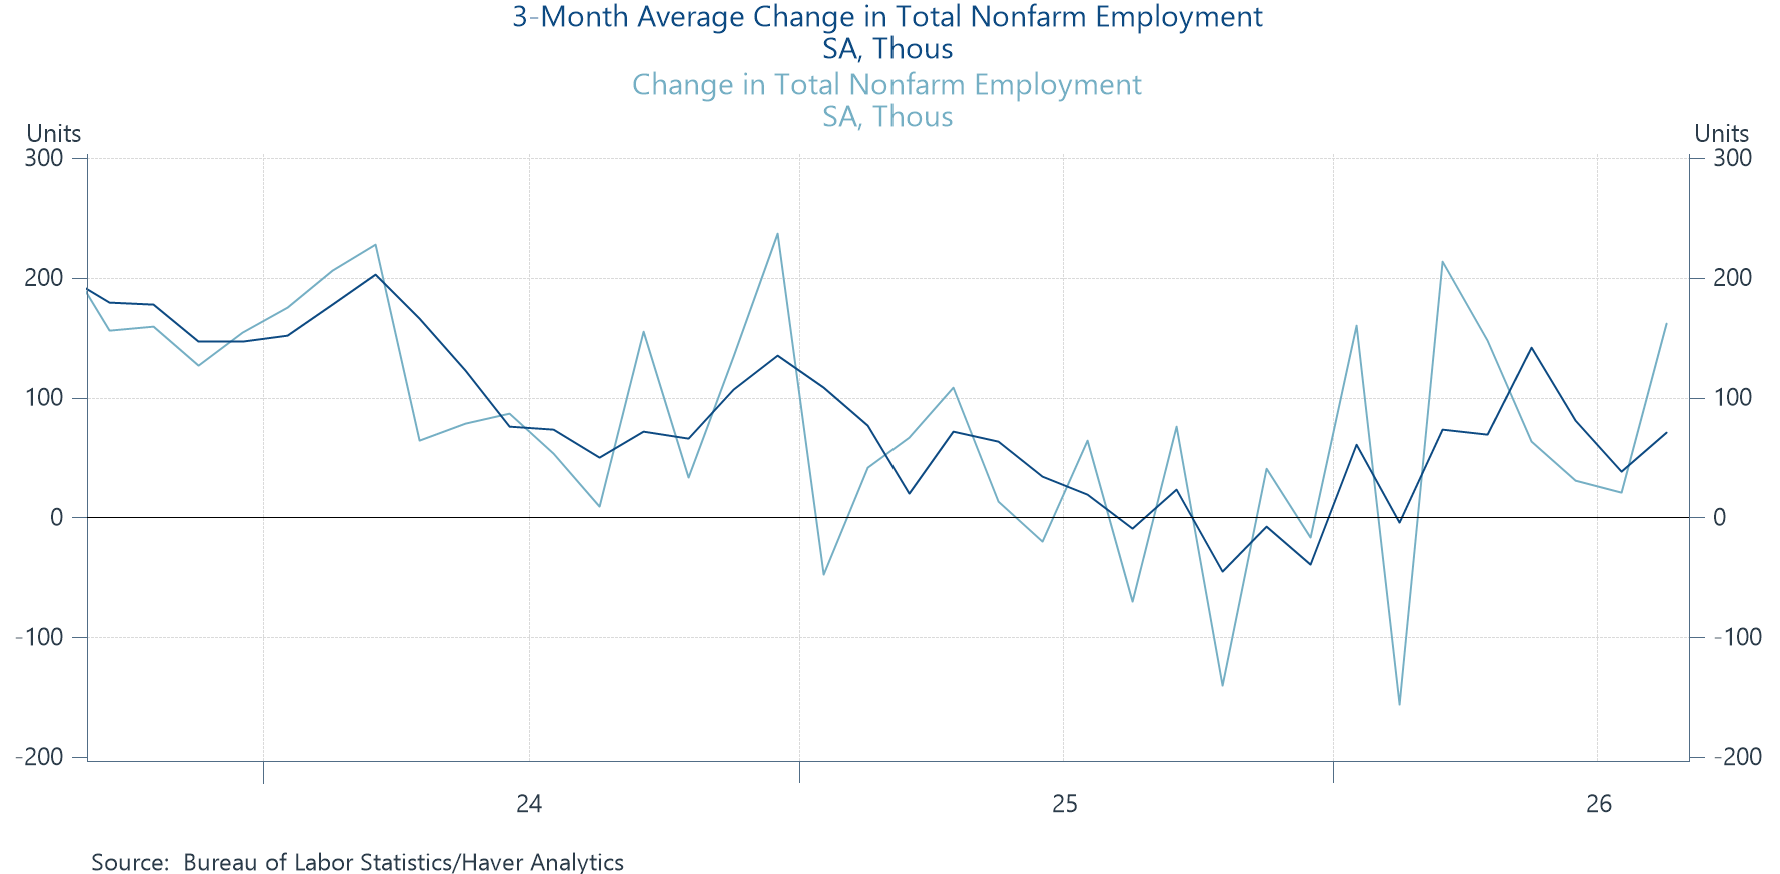
Payrolls rose 162,000 last month, well above expectations for 55,000, and the unemployment rate held steady at 4.1% (4.09% in July, up to 4.14% in August). Revisions added a cumulative 55,000 jobs to the June and July prints, such that the 3-month average—a better way to get at the underlying trend—stands at 71,000, a pretty solid number for a job market with diminished labor supply relative to recent years. Fewer people flowing into the job market means fewer job slots are needed to keep the jobless rate from rising.
The figure below plots the very noisy monthly payroll changes along with the slightly less noisy 3-month-average version. If you squint, two trends are visible. First, average job gains are well below where they were a few years ago, but that’s in part a function of the slower labor-force growth mentioned above. Second, there’s maybe a bit of an upward trend in recent months but it’s still too hard to make out.
However, if the job market—or at least job growth—is picking up a bit, here’s where you clearly don’t see it: wage growth. Nominal wage growth continues to slow, up 3.1% for all private-sector workers in August and 3.3% for mid/lower-wage workers. Though we don’t yet have CPI inflation for August yet, this will probably translate into the fifth month in a row of real hourly wage losses (the Cleveland Fed CPI tracker is at 3.4% for August).
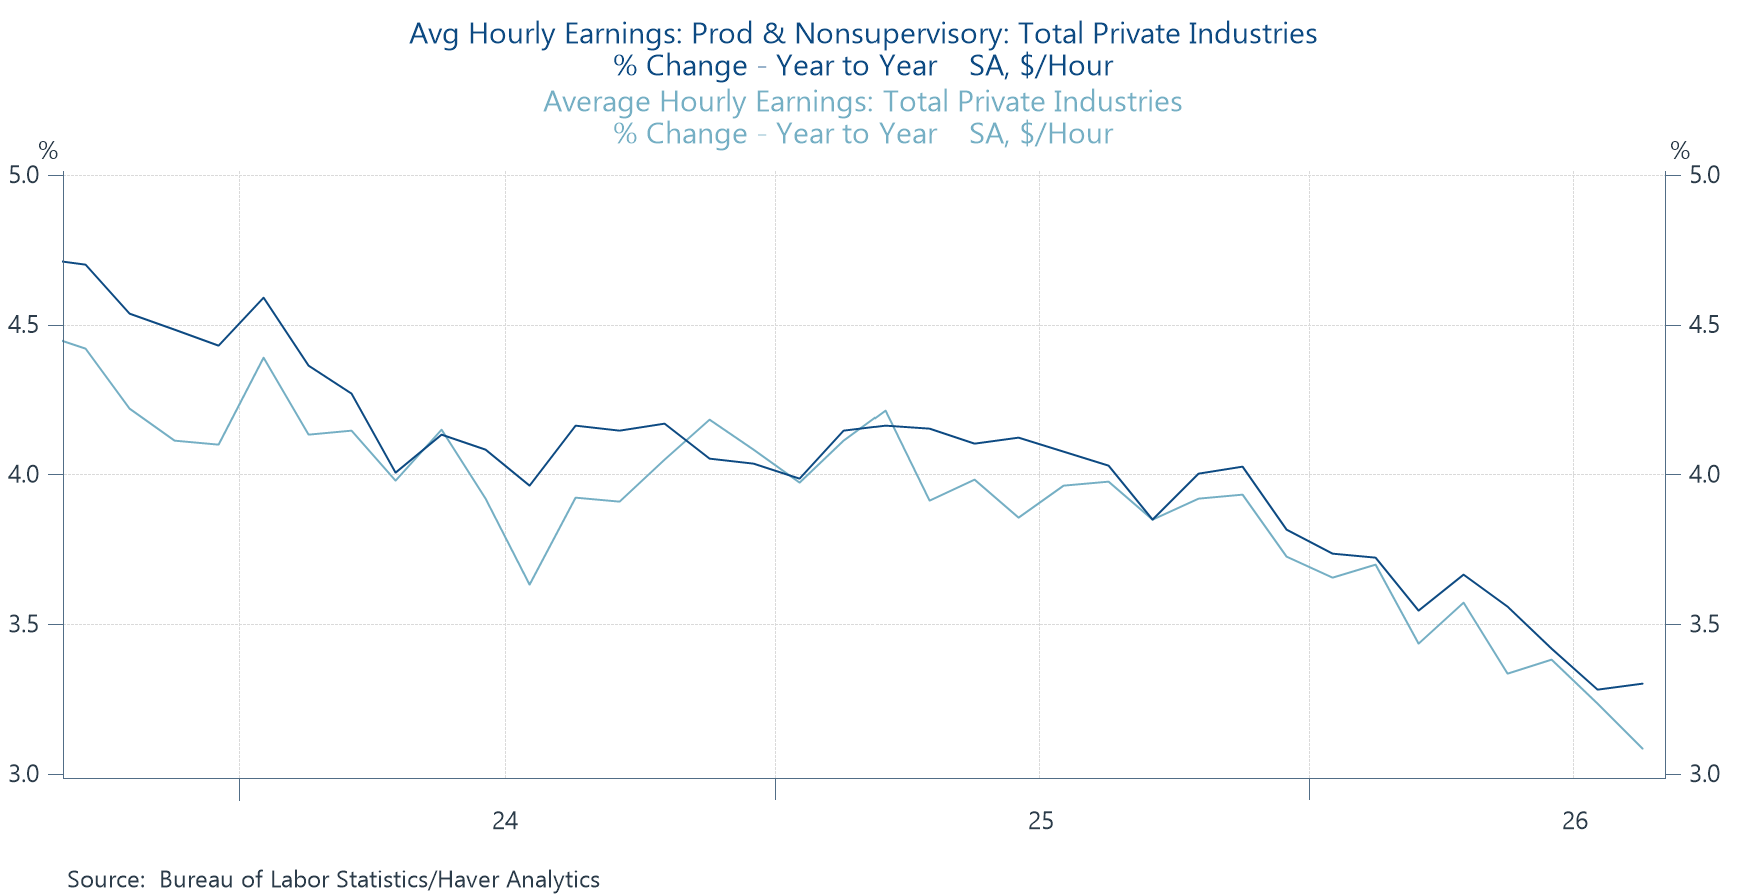
Tight labor markets typically do not present wage trends like those shown above. So, what explains the saggy nominal hourly wage growth? It could be that the job market is less tight than the persistently low unemployment rate suggests (on that front, Econvitals reports that today’s report delivers “the longest streak of the unemployment rate at or below 4.5 percent on record — 58 consecutive months”). We know, for example, that quit rates have fallen over the last few years, and quitting is a way workers upgrade their jobs in tight labor markets. There’s also AI threats lurking in the background and at least one study suggests that this dynamic has a similar wage-dampening impact as added labor supply without added labor demand.
At any rate, I’ve got a busy AM, so no time to go too far under-the-hood, but here are a few of the numbers that caught my eye.
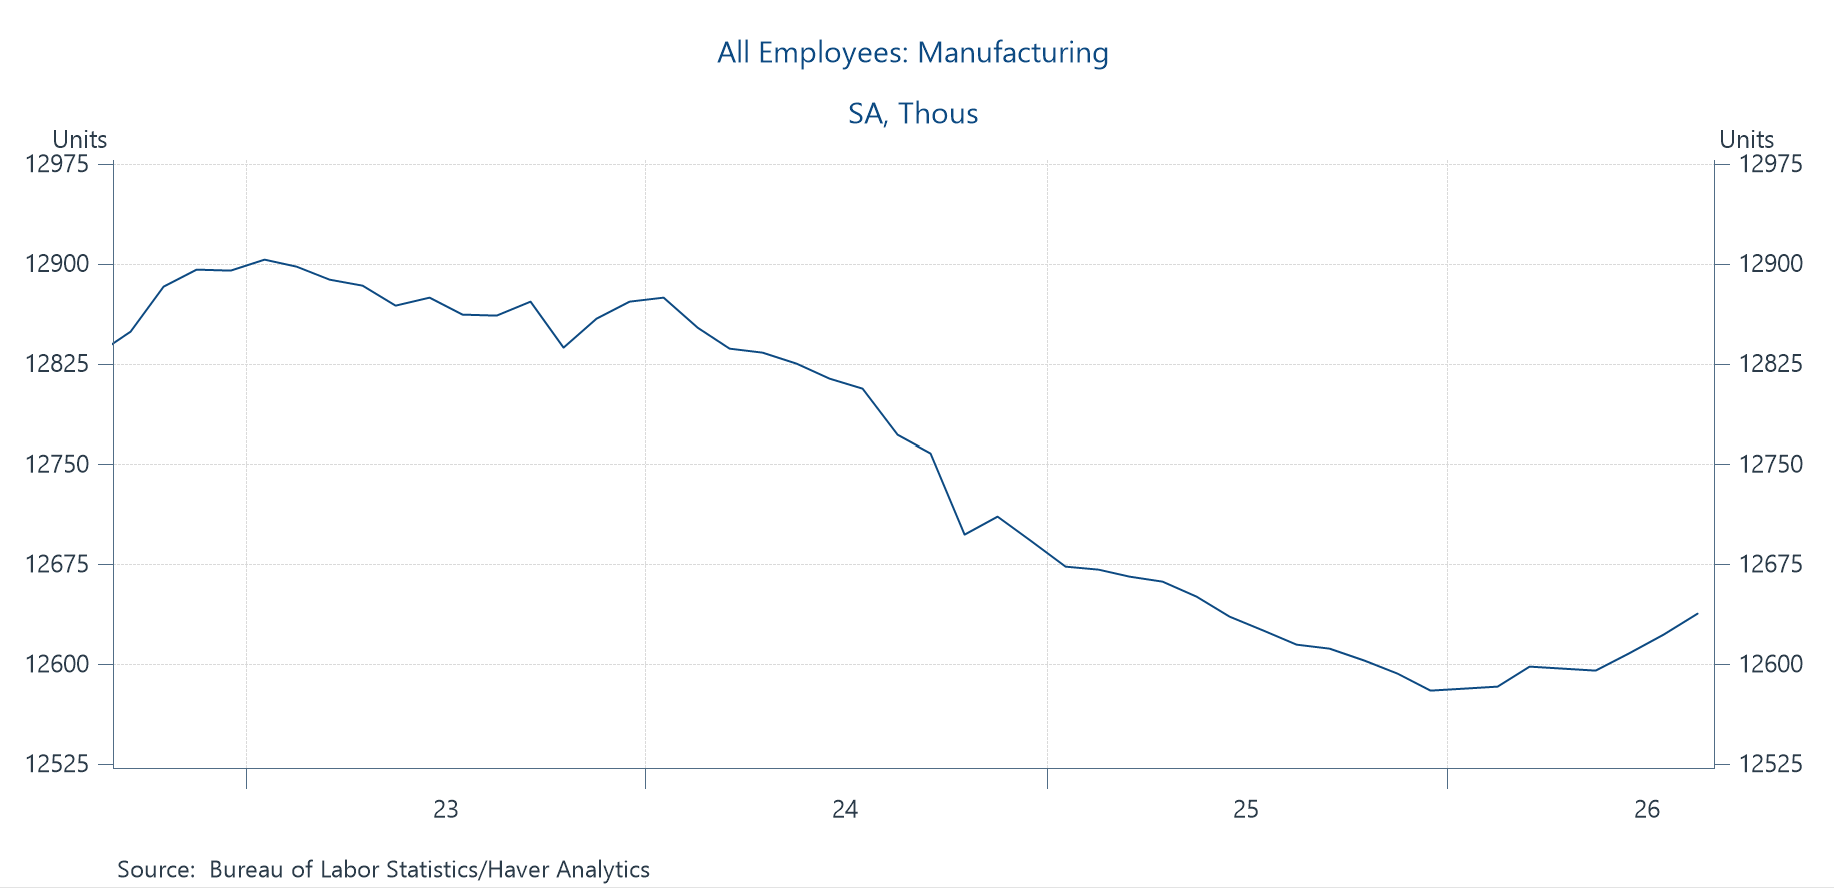
—Manufacturing employment is doing better in recent months. The Trumpies will claim tariffs are working but the rise appears to be wholly in durable goods and within that sector, computer equipment. In other words, this looks like an AI-picks-and-shovels story. At any rate, it’s a good trend to see.
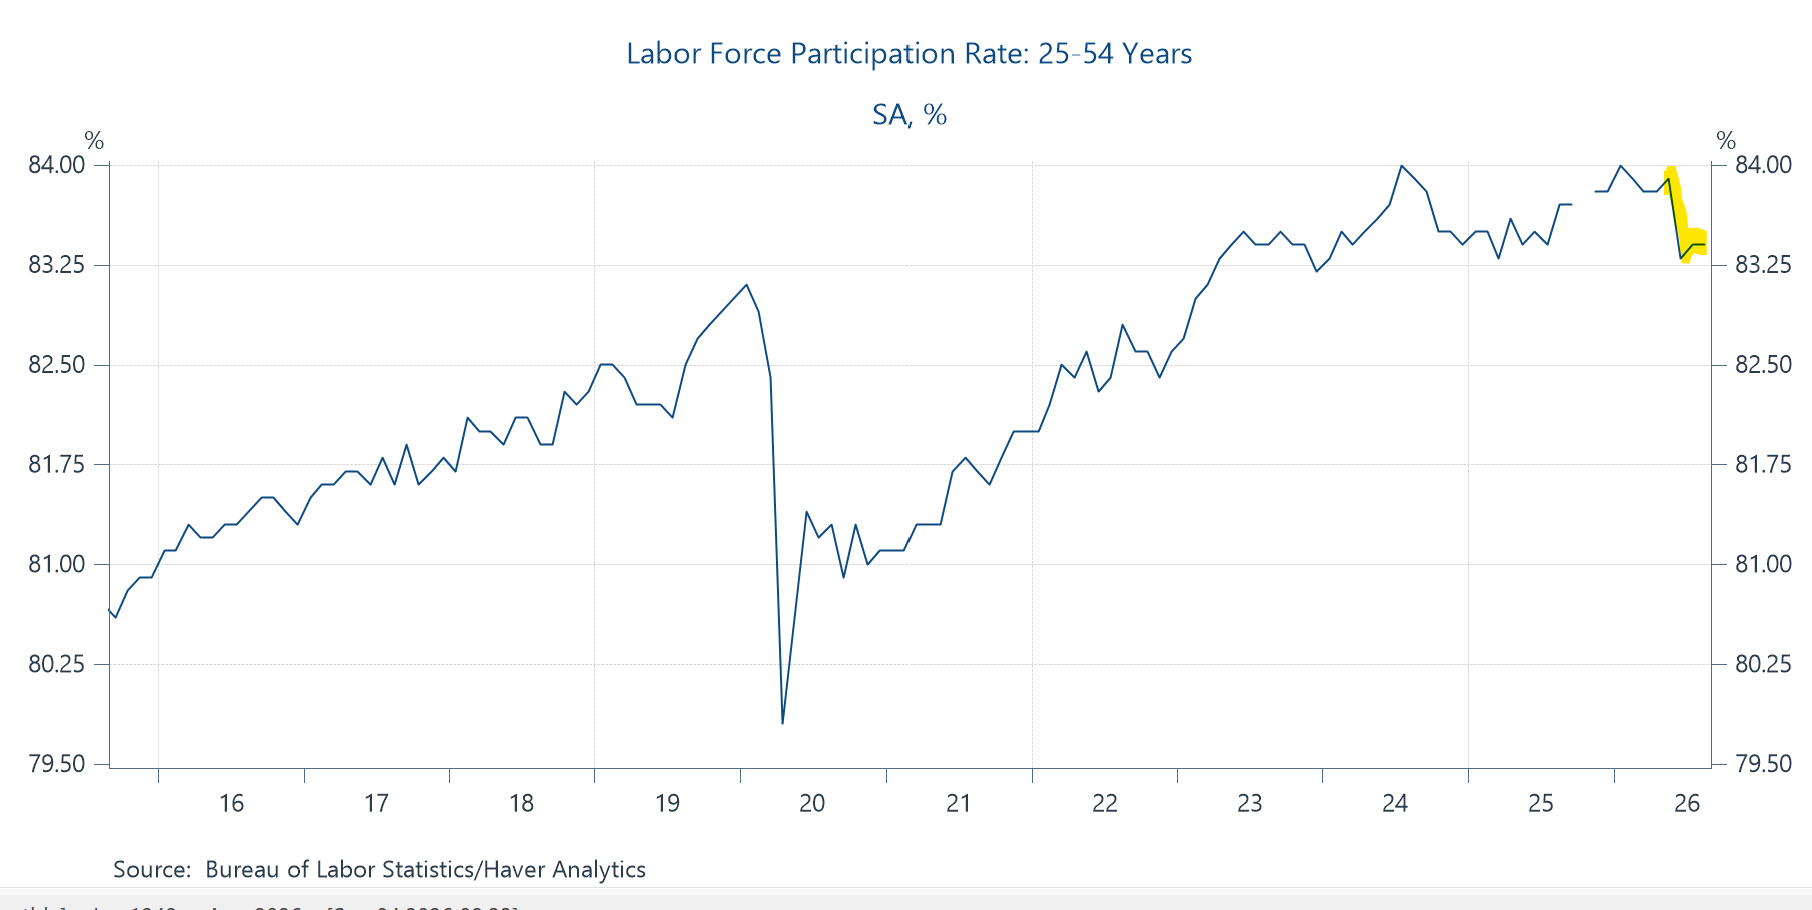
—Re labor supply, it’s useful to track “prime-age” workers (25-54), as that takes out aging-boomer retiree effects (see my analysis of aging impacts on the labor force here). A few months ago there was a big spike down in this series, which looked to me like statistical noise. I still suspect that’s the case, but the series hasn’t yet bounced back, so this bears watching, as it is a salient indicator of labor market health.
—I doubt this report changes much over at the Fed, wherein FOMC members seem pretty split on whether to raise or hold the funds rate at their mid-Sept meeting. The key labor-market linkage would be through the wage channel. If job market tightness was pushing up nominal wage growth, some members would worry that this could further pressure inflation. But that’s not happening. It’s also notable that Chair Warsh recently downplayed this channel, which I found slightly unusual (“in tracking underlying inflation, wage growth has not proven a reliable indicator of future inflation for a very long time”). I’m more with the great economist and former Fed vice-chair Alan Blinder, who once told me “wages lead prices and prices lead wages.” Deep, right??
Forgot to Mention:
I’ve been remiss in not mentioning the preliminary benchmark revision to the payroll survey, which was -79,000. Every year, based on more accurate (but less timely) administrative data from the UI system, the BLS adjusts the level of employment in the payroll survey in March of the current year. “These counts are derived primarily from state unemployment insurance (UI) tax records that nearly all employers are required to file with state workforce agencies.” Because they don’t want to cause a big, revision-driven jump in the March ‘26 level, the BLS wedges the revision into the data from March ‘25 - March ‘26 at a pace of -79K/12. You can read more about it here if you’re so inclined. Remember, this number is preliminary and the final number, which often differs from the prelim, will be in the Jan27 jobs report.
It doesn’t much change any labor market narratives, as -79K is a relatively small revision. If it sticks, it will further reinforce the low-hire narrative: the current payroll series finds that over the 12 months ending March ‘26, employers added 17,600 per month; the -79K revision would lower that to 11,000. Manufacturing was revised down 67K; retail trade, down 155K; government up 99K.
By NOT saying anything at all about the veracity of the jobs increase, I hear you saying that the numbers are suspect. To be fair, I most likely would hear that suspicion sitting alone in the park.
Delighted to see the shout out to the great Alan Blinder, with whom I once co-Authored a book on pricing. I even got a whole $100 of royalties out of it.