
Cognitive Dissonance Alert!
There's the daily dataflow and the ongoing crazy. Do not conflate the two.

We’ve had a few good, if mixed, data reports in recent days. January jobs came in above expectations, and, more importantly (because the signal is better), unemployment ticked down. January inflation came in slightly below expectations. More broadly, fragilities abound but the macroeconomy is kinda okay, if not kinda good, especially if you consider productivity, which is a bit of a holy grail in my world.
But the country is being run—extremely poorly; see the current gov’t shutdown—by what I’m highly confident historians will rank as the worst administration ever to step foot in the White House. State sanctioned killings have yet to be accounted for. They’ve made the budget path even less sustainable. With affordability/cost-of-living challenges bedeviling American households, their signature economic policy—sweeping tariffs—is raising prices.
I’ve long written about this bifurcation, pointing out that in good times, presidents don’t have that much to do with overall growth, though they can skew its distribution. But today, I’d like to drill down on the connection between the monthly data, which I admittedly obsess over, and the broader political economy questions which dominate this Substack.
BLUF, they’re connected, but quite loosely. And understanding that loose connection is key to resolving the cognitive dissonance that can take hold around data releases.
First, given the intense focus by economists, markets, the Fed, and the media on the big econ reports, it is essential to always remember that one month does not a new trend make.
I’m always saying that but it hit me that this begs the question: “okay, then what does a new trend make?!” The circular answer is “a different trend.” The slightly more satisfying answer is enough months and quarters of the data moving in a different direction such that the underlying trend—which can, to be clear, be measured—shifts up or down.
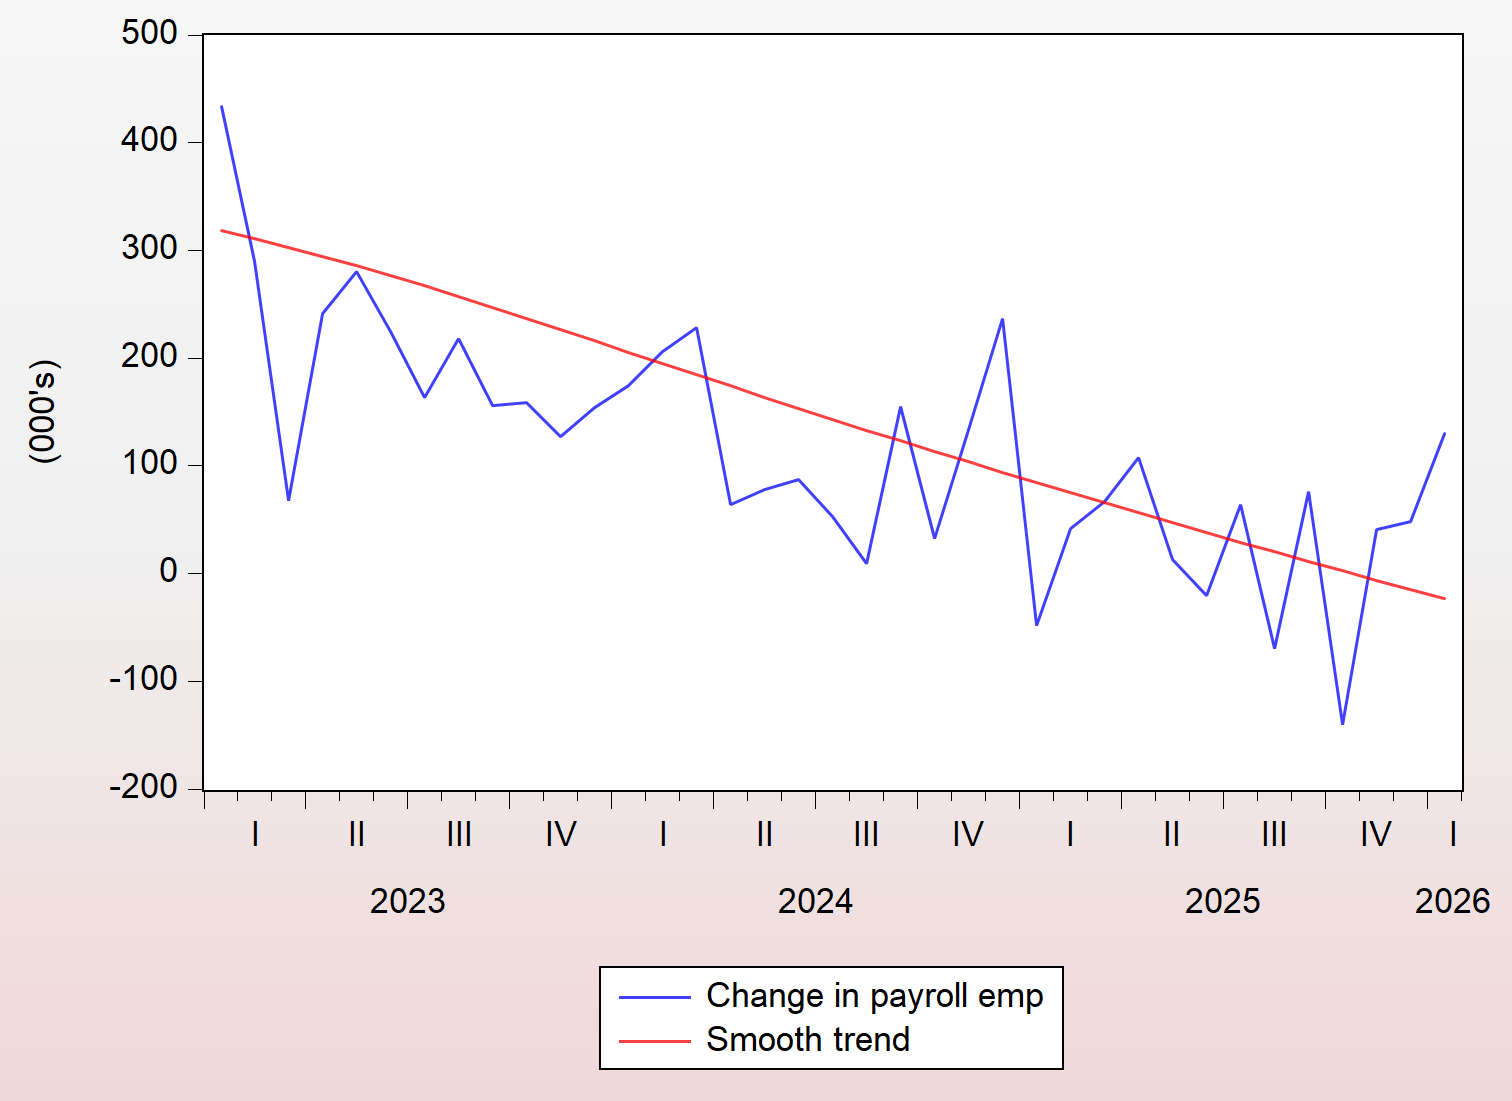
Let’s use the latest jobs report, with its upside surprise of 130K jobs as an example. The below figure shows monthly (not quarterly; didn’t bother fixing x-axis label) changes in employment around a slow-moving trend (a boosted HP filter, if you’re interested). You see lots of monthly data points that are both above and below trend, with the latest read a clear, upside print. That’s definitional: trends by cut through points above and below the trendline. But the negative trend is clear (and, as noted below, became considerably more negative due to revisions).
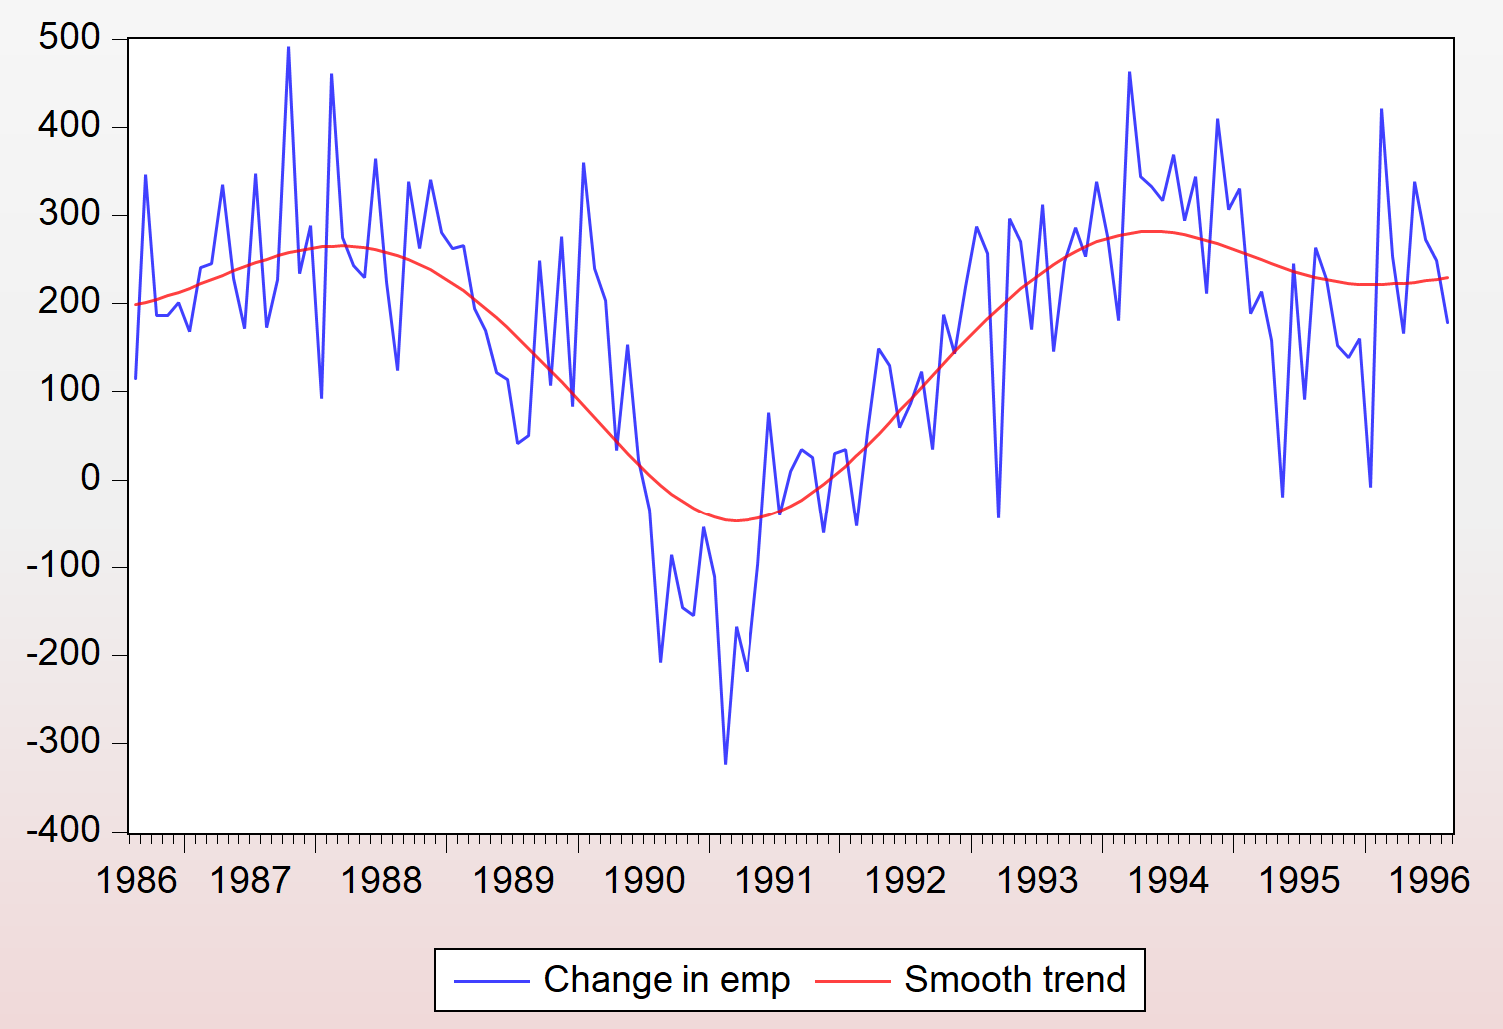
So, what nudges a trend to switch direction? Enough observations broadly moving in the other direction, as occurred coming out of the mild 1990-91 downturn, shown below.
As high-frequency data analysts, we would be remiss to ignore the outliers above and below the trend, but they don’t change the story, which right now is of a labor market that has softened in a particularly troubling way: very low hires. I get into why that’s troubling here.
The other reason to underweight monthly observations is that in many series, they get revised, and job revisions have been especially sizable lately (why that is goes beyond my scope here; residual pandemic distortions and, especially re jobs, changes in immigrant flows are both in play).
Second, in trying to parse out how people feel about the data—econo-vibes—from the data itself, you’ve got to understand what the specific data series mean to people.
Inflation is an extremely salient example. Ever since the pandemic price shock, people became highly uncomfortable with price levels, as distinct from price changes, i.e., inflation. Thus, when you tell them “inflation came in below what we expected,” as was the case with the January headline number, it just means prices are still going up, just the slightest bit slower than we thought (2.4% instead of 2.5%!). That’s important for economists, markets, the Fed—it’s comforting for us to hit expectations because it implies we kinda understand where we are—but it’s far too aggregated to mean much to everyday folks.
For most people, the fact that beef and coffee are up 17% and 18%, respectively, and gas is down 8% matters a lot more.
GDP is another great example. It means a lot to that same group noted above—economists, markets, Fed—but, as long as it’s not tanking, it’s far too aggregated and abstract to mean much to folks, especially when K-shaped dynamics are in play, as is the case now, as best we can tell. If overall growth isn’t reaching folks, why should they get excited about it?
Third, the cognitive dissonance is immediately amplified by the partisan media machine and the administration itself, and not just the Trump admin but all admins. I’ve been an offender in this space, and while I’ve always emphasized the trend points above, just the fact that you’re out there on WHNL (White-House-North-Lawn), going on about how we just added 200K jobs last month or inflation fell by a tenth or GDP rose by 2% annualized, etc., and how this shows the president is awesome, is a pretty good way to talk past people.
At this point, I doubt anyone takes such noise very seriously, which is too bad, because, much as it’s important for the Fed chair to explain to the public what they’re up to, it is important for gov’t economists to explain to interested parties how their interventions are playing out. But you don’t get that from a monthly or quarterly data point.
In fact, you can learn more from longer-term analysis, such as the annual poverty reducing effects from the Biden-era expansion of the Child Tax Credit, or the eventual boom in factory construction from the various industrial policies that President Biden helped legislate. Or the increase in prices from Trump’s tariffs:
Right now, economic vibes are notoriously bad, and also pretty durably unresponsive to data reports one way or the other. As I recently stressed, people are increasingly put off by the chaos of the Trump administration and its lack of attention what’s really bugging them, particularly in the affordability space.
At the same time, for this Substack, I will continue to report on the dataflow as objectively as I can. This is just a reminder not to overly conflate the two.
Some topics are exceedingly sexy and some topics are exceedingly boring but at times it's necessary to talk about the boring stuff because that's where the problems are. Please discuss the Digital Asset Market Clarity Act in future posts. ( I know, I know! Who is interested?) The DAMCA which has already passed the House and awaits Senate confirmation, takes away the regulation and policing of crypto currency from the Security and Exchange Commission and puts the regulation of crypto into the hands of the Commodity and Futures Trading Commission. Until recently, this might have been fine because the CFTC was extremely active in policing and regulating Commodity Futures but under the current administration it has been gutted and its most active office in Chicago now has zero employees. What this means in simple terms is that if the act is passed by the Senate, crypto currency will go largely unregulated. Not good. Many prominent economists already call crypto currency a scam and lifting regulations on it will result in an absolute license to steal from the unwary. The attention of the public is on compelling news stories:The Epstein files; Killings by ICE agents etc. While these are important, it is also important to focus attention on a huge scam that is underway to launder money through crypto currency.
It’s easy to fly in sunny weather and smooth air. So far the pattern has been reasonably favorable on the economic front outside of the bad vibes . What frightens me about this administration is how they will be utterly incapable of navigating through the stormy weather that inevitably happens from time to time.
It’s even worse when the administration itself creates the turbulence in the first place .