
Data_Note: More bad soft data; some meh hard data
People really, really dislike tariffs.

The UMich consumer sentiment survey continued to drop in today’s preliminary release of May data. It’s now down to its 2nd lowest level on record. As you see, consumers’ expectations about the future are also down, while expectations of inflation are up, both near-term and long-term (second figure).
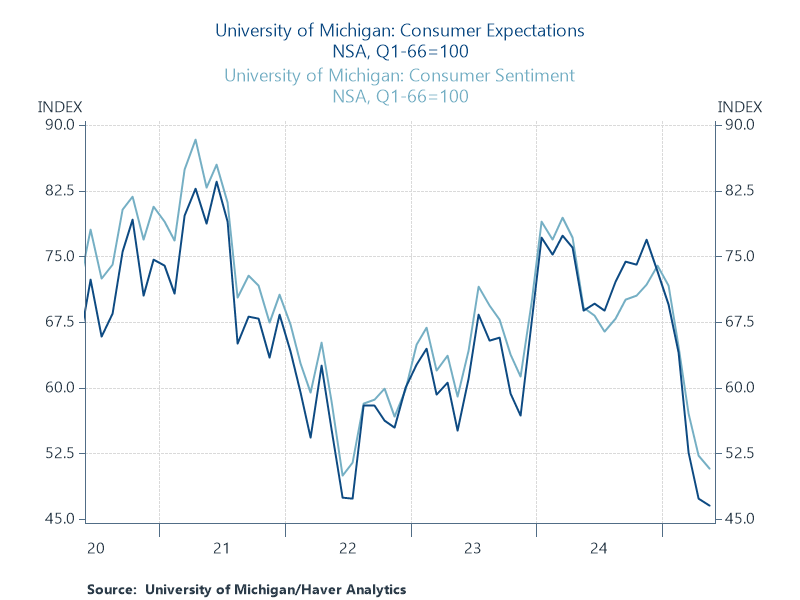
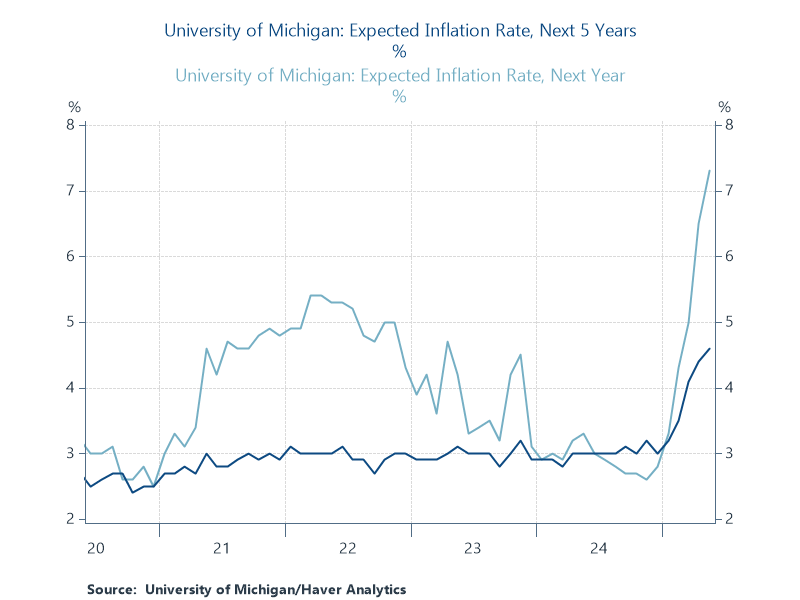
These surveys have gotten increasingly partisan, but even Rs are getting bummed out. Their sentiment was down 7% in the first half of the month and their inflationary expectations were up.
The data for this report were fielded mostly before the rollback of the China tariffs (from 145% to 30%), so my guess would be that the final May data looks a bit better than this.
Allow me to be a many-handed economist for a moment. On the one hand, there’s an telling signal in these data that people understand something I consider to be fairly nuanced: Trump’s trade war is bad news for them. That’s not obvious as past polling has revealed support for such protectionism. But the survey director stated that “Tariffs were spontaneously mentioned by nearly three-quarters of consumers, up from almost 60% in April; uncertainty over trade policy continues to dominate consumers’ thinking about the economy.”
My guess is the fact that people were already unhappy with price levels and the steady drumbeat about the price effects of the President’s trade war—the media’s been good on this—is behind the negative and positive spikes shown in the figures.
On the other hand, the split between bad vibes and good data has gone on for years now, leading me to wonder, especially given the rise in partisanship as a driver of the movements in sentiment surveys, if these surveys have much real economic content. There’s a decent chance that they reflect not economic sentiment or confidence at the survey date based on perceptions of jobs, inflation, interest rates, buying conditions and so on, but more a broad sense of malaise and annoyance with what’s going on in the country.
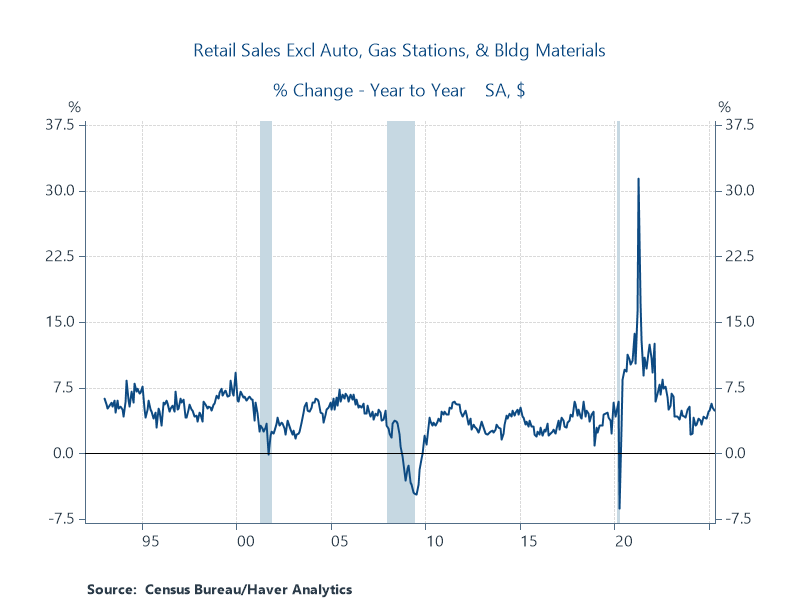
Turning to hard data, core retail sales—the part of the report that feeds into GDP—ticked down in April (-0.2% ) against expectations for a small rise. It’s not a good sign but this is a noisy series that covers only about a third of consumer spending, and the smoother yr/yr trend, shown below, looks fine.
Housing starts continue to come in soft and slumpy:
Single-family homebuilding dropped to a nine-month low in April as tariffs on imported materials combined with higher mortgage rates raised construction costs, which could hamper the housing market recovery this year.
The report from the Commerce Department on Friday also showed permits for future home construction fell sharply last month.
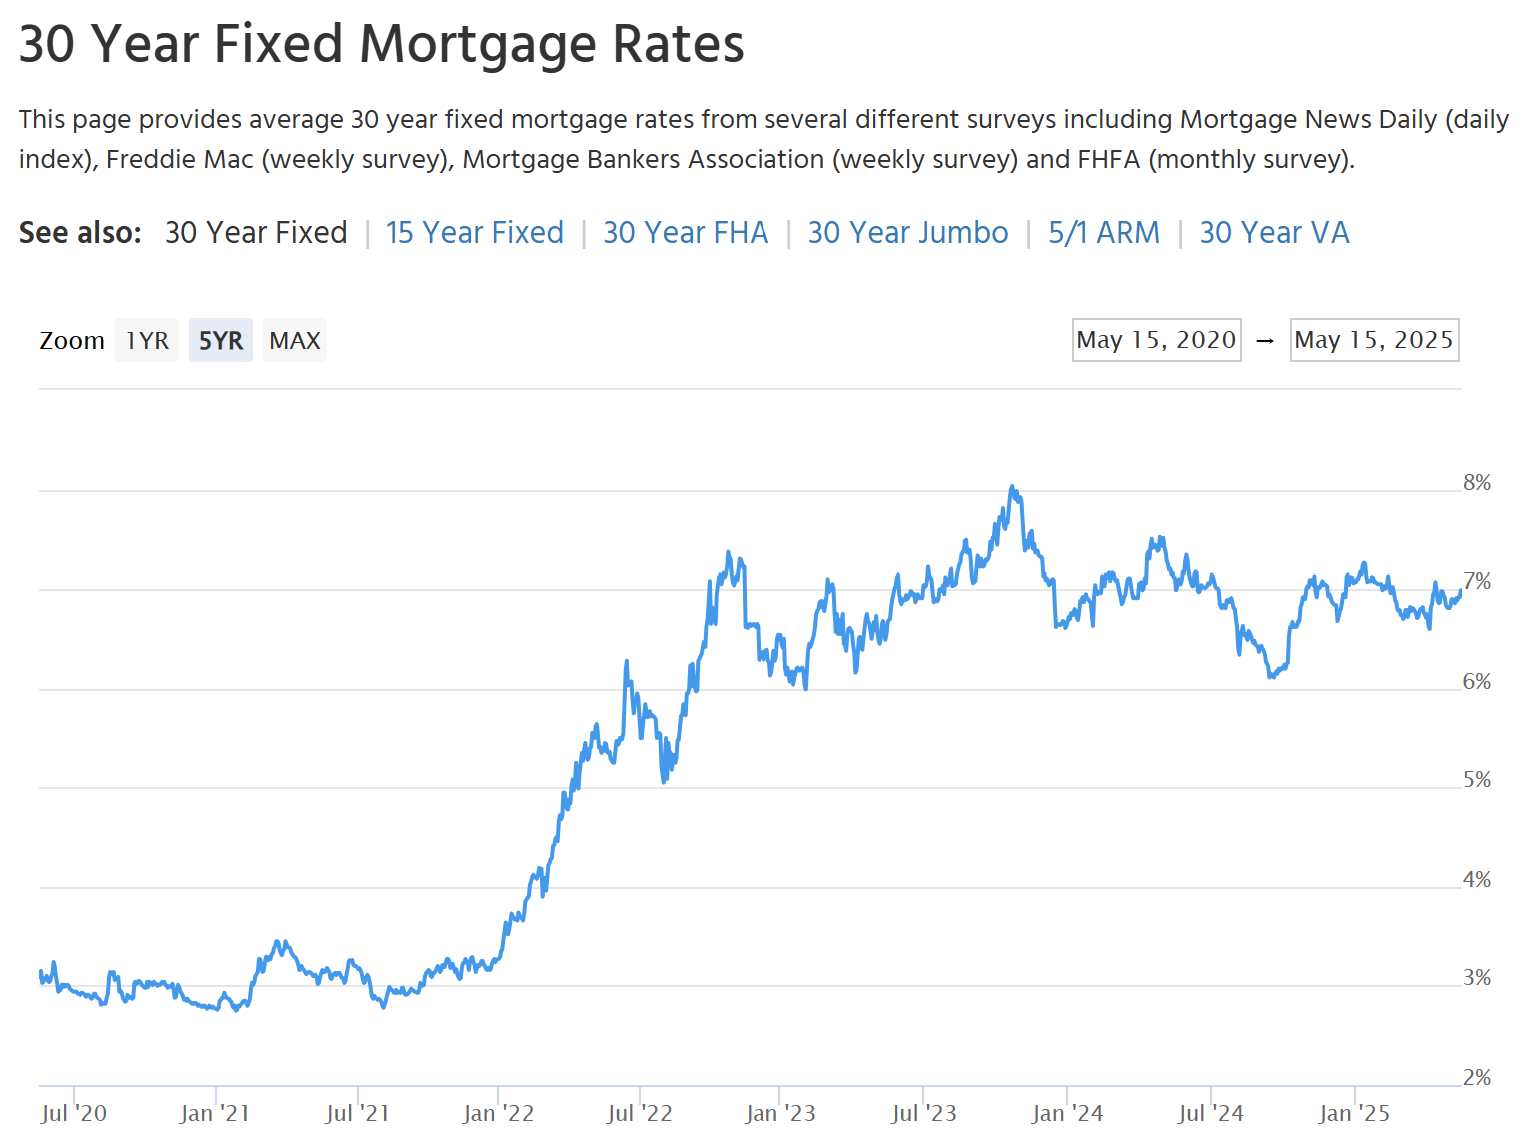
Mortgage rates have been stuck at ~7% since mid-’22 (see figure). Always hard to know where rates are headed but gotta say, this is looking and feeling like the new normal for this important price. Also, there are some—for now, faint—signals that the bond market could take a jaundiced view of the R’s forthcoming budget plan. My moderately strong prior is that the bias for where the interest-rate term premium (the extra points on the interest rate that lenders need to buy longer-term debt) is headed is up.
Summarizing, I’d take a lot about the current economic moment, but in vibes and real data terms from what this guy John Rainy, Walmart’s CFO, told the WSJ this week:
A 30% tariff on Chinese goods is better than 145%, but still means a meaningful price increase for most consumers.
Walmart is a benchmark price setter, large majorities of us shop there, and they’re already starting to raise some prices. These price effects, along with tariff-uncertainty impact on business planning and investment, are likely to start showing up more than they have already in forthcoming data.
I’d like to be wrong about this, and, if so, I’ll be first to admit it. After all, we’re in unchartered waters (though the ship’s captain is bat-crazy), and the U.S. is less exposed to international trade than most other advanced economies. But neither I nor most other economists would predict anything else given an increase in the effective tariff rate from around 2.5% to 15%. It could be a long summer.
Anecdatum: My flight from LHR to ATL yesterday had swaths of empty seats. Folks bagged 3-across vacant rows to stretch out. I can't recall when I last saw that. Maybe Brits really have decided against braving the vagaries of Noem's border force or spending their travel budget on a bad actor? If so, wait for airline and hotel layoffs
All the talk about soft data not being confirmed by hard data reminded me of 2008.
So I went to check my memory about the sequence of facts (below) and then spent some time on the FRED site.
(sequences of events source: https://www.cfr.org/timeline/us-financial-crisis )
The US housing market peaked in 2006. Declines accelerated in 2007 and then really got going in 2008.
The sub-prime mortgage market outside of the Too Big To Fail banks crashed in 2007.
US Fed and ECB started cutting rates in 2007 (something the US Fed will be reluctant to do this time round).
The S&P rose from 1400 to almost 1600 during 2007. It slid to 1250 a few times early in 2008, rallied from March to June but by July started heading lower. By 2009 it was 50% down from that 1400 average.
U Mich sentiment peaked in Jan 2007 and declined throughout the next 2 years.
Housing prices fell from 2007 through 2011.
Initial Jobless Claims were flat through 2007, rose a bit in H1 2008 and only broke substantially higher in August of 2008.
Non Farm Payrolls rose through 2007 and only started declining in May of 2008.
You can see all the graphs at this Bsky post (only because I can't post images on this substack)
https://bsky.app/profile/capemaydave.bsky.social/post/3lpcvftjui22v
The "soft" sentiment data was consistent with the decline in housing prices but the view on Wall St. (who via consolidation survived the 2007 crisis) was that this was survivable because (I remember distinctly) no substantial economic decline was clear in the hard or establishment data.
Housing was the growth driver in the post Tech bubble early 2000s. Consumers were living it and complaining about its absence.
Small business growth since Covid has been, inter alia, taking advantage of the extended global supply chain.
Sentiment data is telling us the same thing it was telling us in 2007/08. Indeed. It's yelling that things are worse than they were then (adding the caveat that this data is relative so absolute comparisons are dubious).
Ignore this at your peril