
Data_Note: Q1 GDP at -0.2% (vs. initial print of -0.3%) but Consumer Spending Marked Down
And continuing UI claims are raising the old eyebrow a bit.

This AM’s data reports feature a couple of numbers I’m not loving, though nothing alarming.
First, we got the second reading, based on more complete data, of real GDP growth for Q1, which came in at -0.2%. BEA said the slight improvement—the first print came in at -0.3%—reflected “an upward revision to investment that was partly offset by a downward revision to consumer spending.”
The slight contraction in the first and second prints were due to an historically unprecedented downward spike in the trade balance (imports are a subtraction to GDP, necessary in order to net out foreign, as opposed to domestic—the D in GDP—purchases), which came in even a bit larger in today’s update (it went from taking 4.8 ppts off of the growth rate to 4.9 ppts due to a markup in imports not offset by a smaller markup in exports):
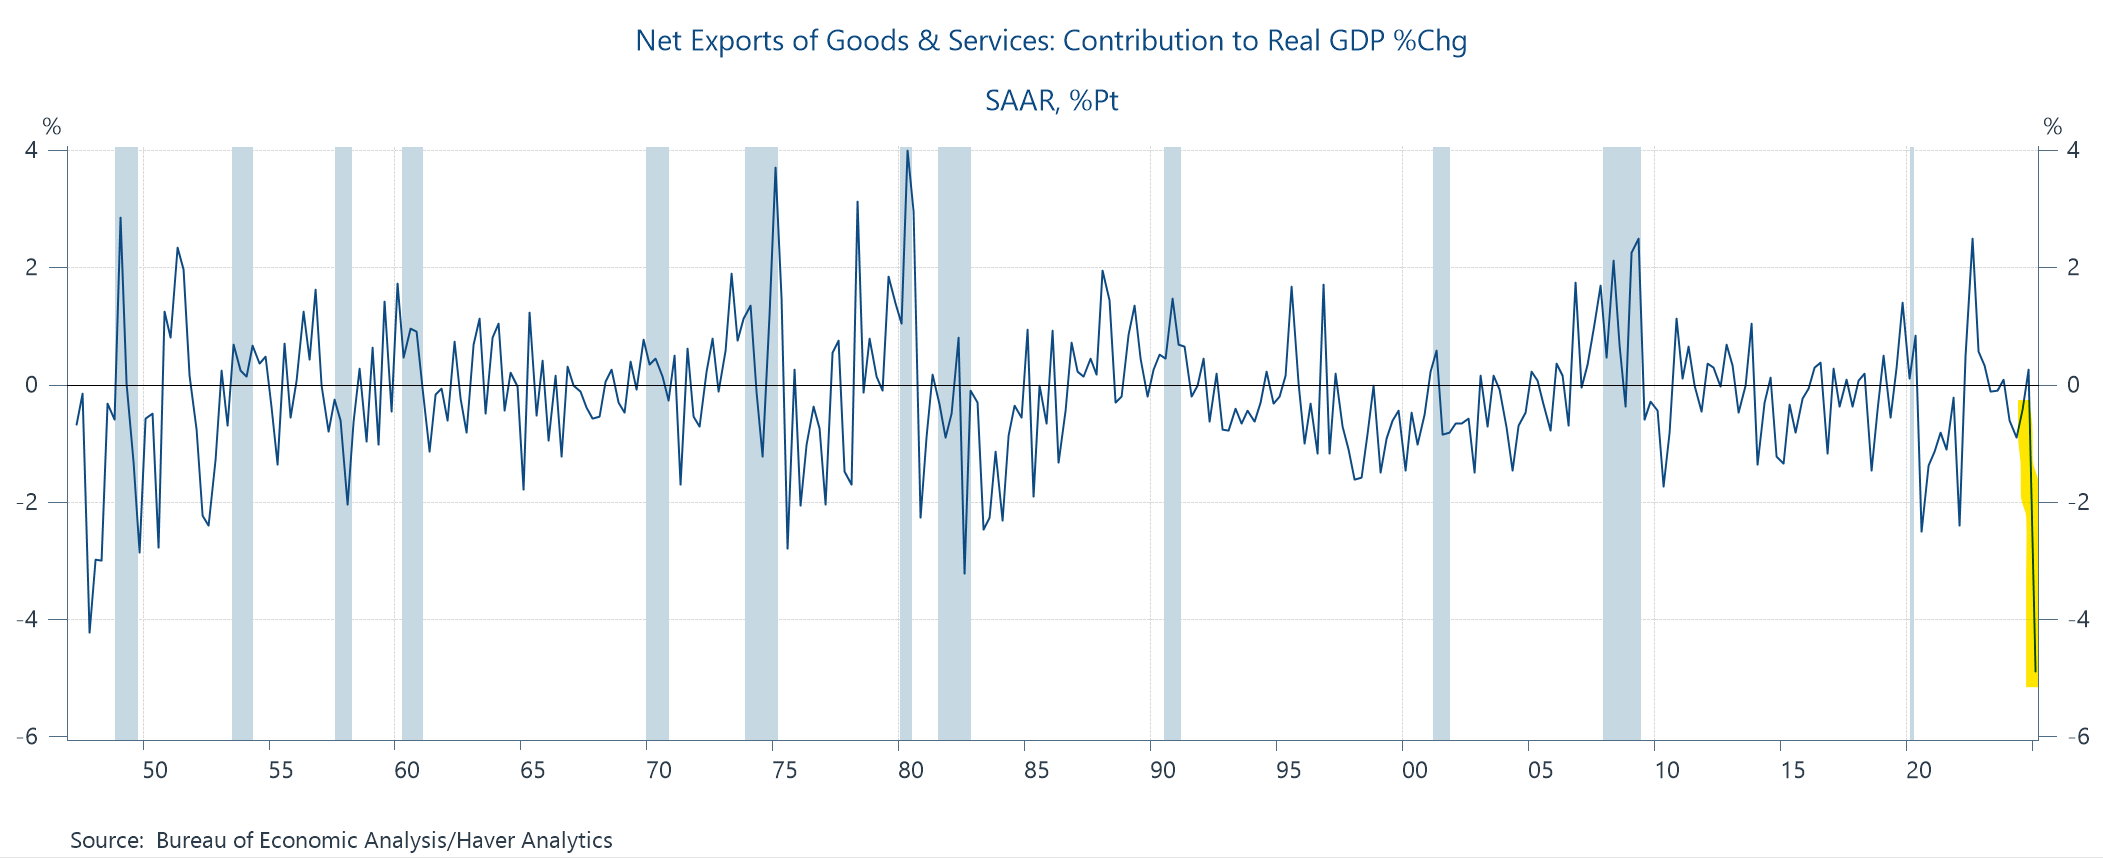
As with the advanced report, it would be a mistake to overreact to the negative topline number, as this is clearly not an economy hitting the wall. Instead, it’s a bunch of importing businesses trying to front-run the tariffs, which are a holy mess as of this (great) court decision I wrote about earlier today. If you take out the trade balance and a relatedly noisy category—inventories—you get GDP growing at 2% (down from 2.3% in the first print—this measure is final sales of domestic purchases: consumer spending, non-inventory investment, gov’t spending).
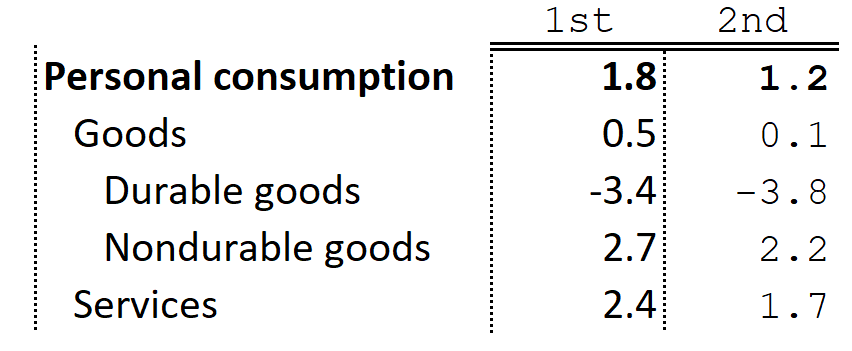
But here’s the thing that caught my eye that I didn’t like so much. The growth rate of real consumer spending was marked down from an already meh 1.8% to 1.2%, a pretty big markdown for this sort of thing. Here are the real, annualized ‘25Q1 growth rates for the 1st and 2nd prints. Both goods and services spending were marked down a good bit. And to put that 1.2% in context, note that from ‘22-’24, the average real spending growth rate was 2.6%.
Ok, caveat time. One quarter, and a somewhat weird one, doesn’t make a new trend. The labor market is still solid and in recent years, the combination of full employment, falling inflation, and rising real wages has supported strong consumer spending, which represents almost 70% of U.S. GDP. But this, in fact, is why this soggy number caught my attention: if real spending stumbles, we’ve got a problem.
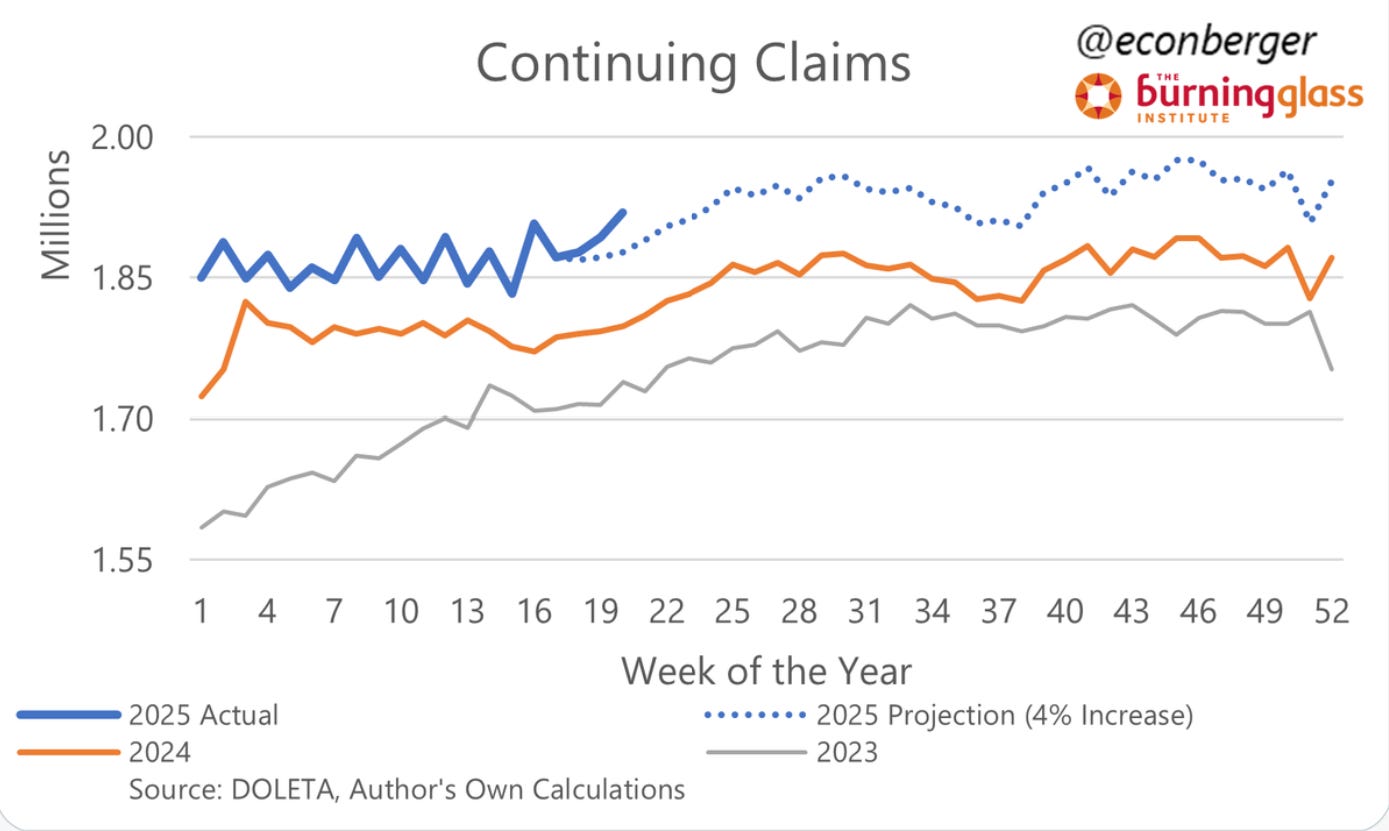
Which is why this figure from Guy Berger, my go-to guy on Thurs AM when the Unemployment Insurance claims data come out, caught my attention. Guy tweeted that “Continuing claims really does [I would have said “do”] look like a modest deterioration relative to benchmark - this week's print was about 32K above it.”
Back to caveats, until we see a bone fide increase in layoffs in both the initial UI claims and in the monthly job reports, I’m not going to over-torque on this. But my sense is that there’s potentially some softening of the job-market-consumer-spending nexus that has been at the core of solid U.S. macroeconomic growth for the last few years.
Another really insightful set of comments i just dont find elsewhere. Thank you!!
I know it’s wonky, but I think you should explain more clearly why it makes sense in this case to look beneath the trade balance and the change in inventories. The GDP calculation is, in the end, an attempt to measure domestic production. A surge in imports shouldn’t affect that calculation in principle; it should show up mostly as an increase in inventories. Since those are hard to measure, it is quite likely that the drop in real GDP reflects imperfect alignment between two variables (imports and inventories) that are both hard to measure.