


GDP Up 3% in Q2 But Just 1.3% in First Half
Import spikes distorted Q1 (down) and Q2 (up), but averages and core measures show growth slowed in the first half of this year.

The economy expanded at an annual rate of 3% last quarter, above expectations of 2.5%, as real GDP growth bounced back from its 0.5% contraction in the first quarter. The year’s first quarter was biased down due to a surge in imports (tariff frontrunning), while Q2 is distorted in the other direction as imports tanked (imports are a negative for GDP, which measures domestic production). In fact, trade’s contributions to GDP growth were historical records—in different directions—for both quarters (see figure below).
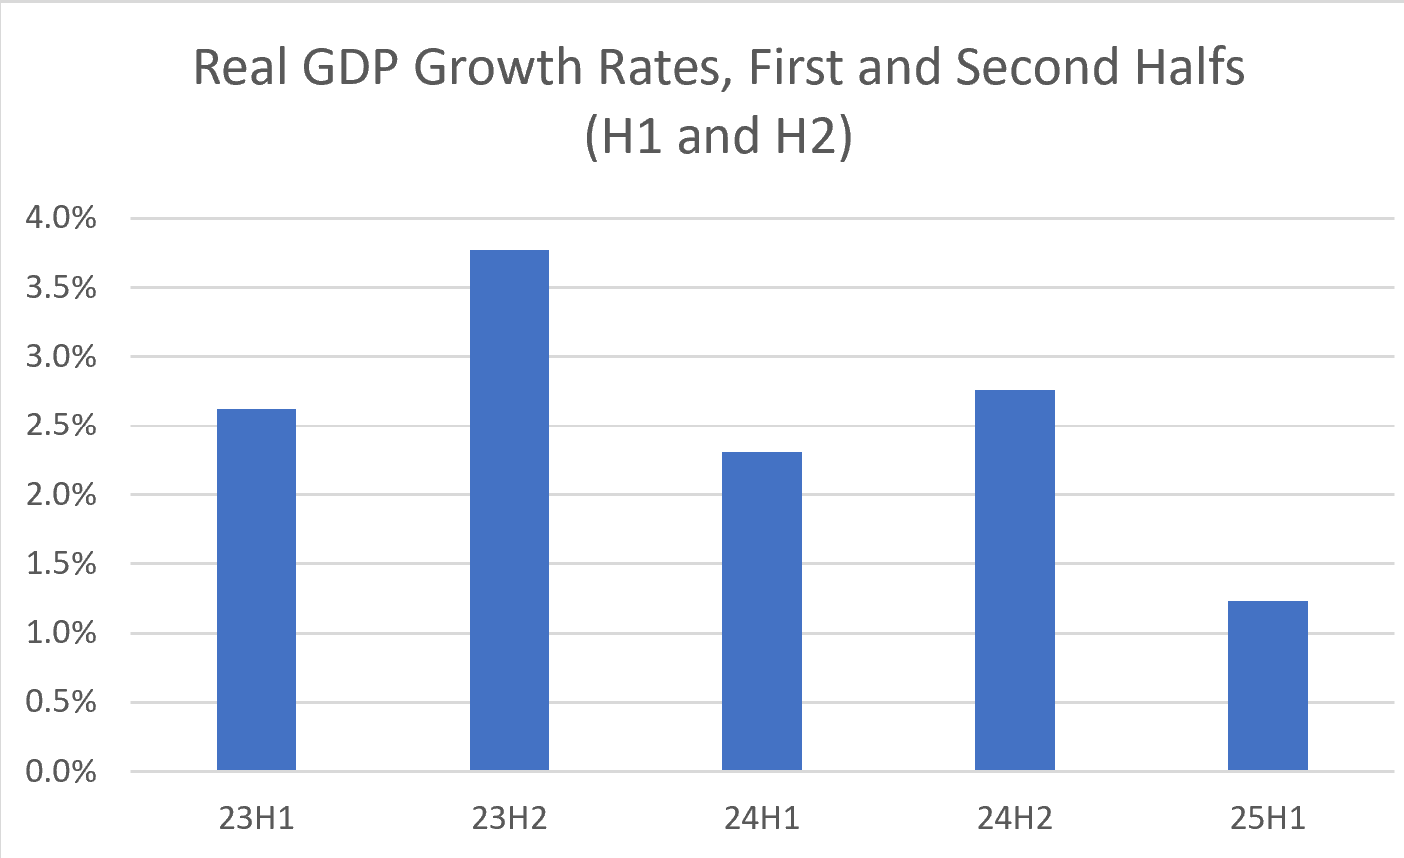
Therefore, the best way to assess the economy’s underlying growth pace is to average the two quarters, giving us 1.3% growth in the first half of the year (H1). That’s a significant slowdown from the prior few years, as shown in the figure below.
The table below captures some of the main numbers. Along with the overall growth rates, it shows GDP’s largest single component: consumer spending (68% of nominal GDP last quarter). Real spending was up 1.4%, adding just under a point to GDP growth, and averaging to 1% over H1. That’s a clear slowdown from last year’s average spending-growth-pace of 3.1%. It is the case that spending grew at an above-average rate of 3.9% in 2024H2, so some degree of slowing was expected. But, as noted below, I’m concerned that these 1.3% overall and 1% spending growth rates are reflecting highly disruptive policies by the Trump administration that are leading to some degree of consumer angst and retrenchment.

The table also shows two “core” measures of real growth, both of which exclude the trade balance (distorted by the trade-war effects of inventory front-running in Q1 and the opposite in Q2) and inventories (highly volatile component, also impacted by imports’ ups-and-downs). These core measures show evidence of slower growth, as both grew at around 3% last year.
Evidence for the need to average out the first two quarters can be seen in the figure below, showing the contribution of the trade balance to real growth. In Q1, it subtracted a record 4.6 points from the growth rate and in Q2 it added an equally, but offsetting, whopping 5 points.

What Does The Report Tell Us About the Bigger Picture?
First, we should note that this is the advance GDP report for Q2, and is therefore based on incomplete data, so revisions will be forthcoming. But assuming the numbers stay around where they are, as is often the case, H1 (first-half) growth was notably below the U.S. economy’s underlying, at-capacity growth rate of around 2%. The problem with falling short in that way is that, should it persist, it generally means that overall economic demand will be too weak to prevent unemployment from rising.
There are two competing narratives about the current U.S. economy, both of which reference pressures from Trump’s policy agenda. One is that the highly resilient U.S. economy, with it still strong labor market, profitable corporations, and perpetually optimistic stock market, can slough off whatever Trump throws at it. As long as tariffs settle in around the 15% benchmark and we don’t see rising layoffs, we’ll cruise over this H1 speed bump and be fine.
The other, darker narrative notes that both hiring and spending have significantly slowed, tariffs are now clearly passing-through into consumer prices, and their impact is likely to grow as the buffers that heretofore held off such passthrough (inventory builds, profit-margin compression) are eroded. Deportations and diminished immigration create wage pressures that will make already sticky inflation even more so. There’s pressure on interest rates from the significantly worsened budget outlook, not to mention the president's daily harassment of the Fed.
I’d assign weights of 30% to the “it’s-all-good” scenario and 70% to “no, it isn’t” one. My reasoning is that while I loudly applaud the flexibility and resilience of the U.S. economy, I don’t believe it is impenetrable to relentlessly harmful policies. Not that I’m predicting recession; more that I fear the 2025H1 slog is likely to continue. I see nothing in today’s report to alter those weights, but as incoming data (hopefully) clears out the data fog, I’ll adjust accordingly.
Jared stripped out the role of imports by noting Final Sales to Private Domestic Purchasers, which equals consumer spending plus gross private fixed investment. This is also Noah Smith’s preferred measure.
FSPDP rose at an annualized rate of +1.2% in Q2 2025. That’s down from +1.9% in Q1, reflecting weaker underlying demand even as headline GDP came in at +3.0%
How much of an impact has decreased tourism had? More generally, are goods holding up better than services?