



[THIS ISN’T ROCKY, BUT THIS IS WHAT HE LOOKED LIKE]
There’s a small and nerdy cottage industry that asks the important question: how did we get into the public debt jam in which we are clearly mired?
In extensive writing over the years, we’ve argued that didn’t need to be overly concerned about the fiscal outlook. Interest rates and therefore debt service were low relative to economic growth, and annual deficits weren’t that worrisome. That’s no longer the case. The budget math has worsened, rates are higher, in part because our creditors want extra compensation for buying especially longer-term bonds, as they’ve become more worried about the long-term fiscal path. Annual deficits are much higher than they should be, given the economy’s overall growth rate.
How we got here turns out to be a more complicated question than you might think. The simplistic, definitional answer is that the federal gov’t spent more than it taxed, but as noted, that’s not necessarily problematic. Households, companies, and gov’ts often do so, borrowing from the future to invest in the present, as when families borrow to send their kids to college. Most of us would want the gov’t to borrow and spend to fight necessary wars—the last time our debt/GDP was this high was during WWII—or stave off the economic pain of recessions (or pandemics) or invest in R&D and infrastructure with reliable returns.
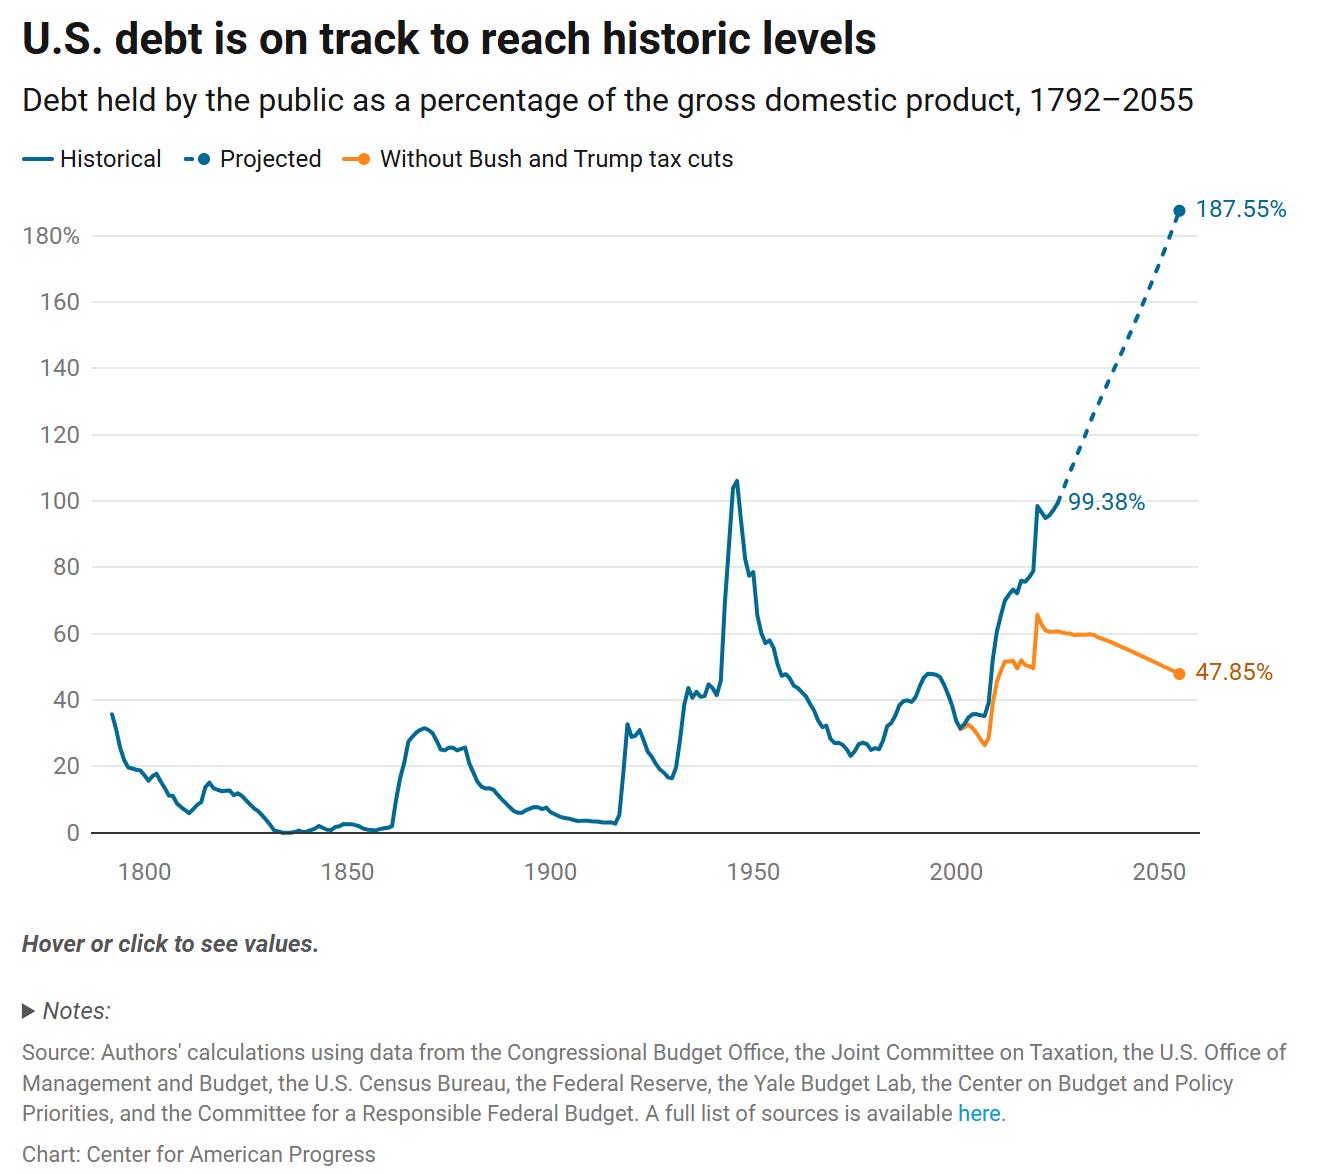
In fact, analysts offer quite different answers to the how-we-got-here question. In a recent CAP paper, we argued that the main culprit is the relentless ratcheting down of US taxes. We show, for example, that absent the Bush and Trump tax cuts (including their extensions), our debt trajectory would look very different and would be a lot more sustainable.
Others argue that gov’t spending is the bigger deal. One proponent of this view comes from the very sharp Jessica Riedl, someone who consistently makes important contributions to budget analysis. Here’s an example of her spending-is-the-bigger-problem argument.
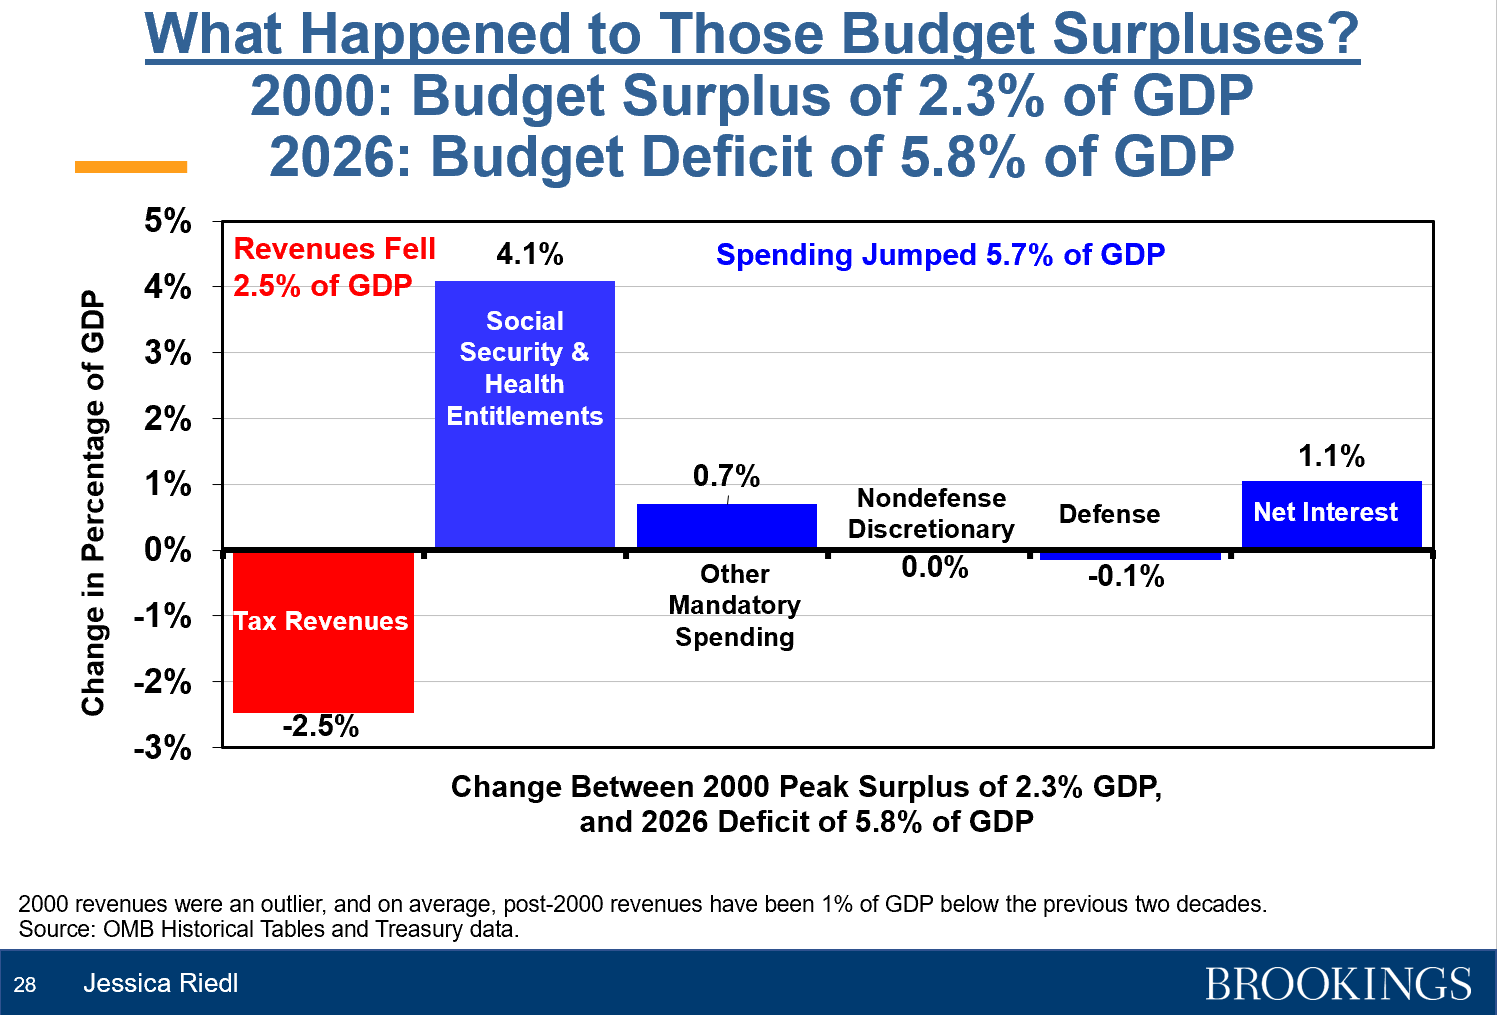
How can both of these figures be correct (which they are, ftr)?
The main answer comes down to compared-to-what, or what budget analysts call “baselines,” and we don’t mean the funky kind. We’re asking a question about where the budget path is headed given its current, underlying fiscal structure, which we believe is the relevant question in that it best informs us about what fiscal policy changes are required to jump from our unsustainable path to a sustainable one. This analysis accounts for the fact that higher spending is baked in the cake, in no small part due to aging boomers like Jared (and unlike Bobby and Jessica).
In other words, we’re not saying spending isn’t going up, or even that it didn’t go up faster than revenues fell in the period covered in Ms. Riedl’s chart above. We’re saying that we’ve known forever that such spending was on the rise, but we used to have a tax system that was set to keep pace with that rising spending, and if anything, thanks to lower-than-expected healthcare spending (partially thanks to Obamacare), it’s rising more slowly than we expected. The big change is on the revs side, with all those tax cuts the culprit.
In that regard, here’s the eye-opener from our work, which admittedly requires some unpacking (see the underlying doc for the gritty details):
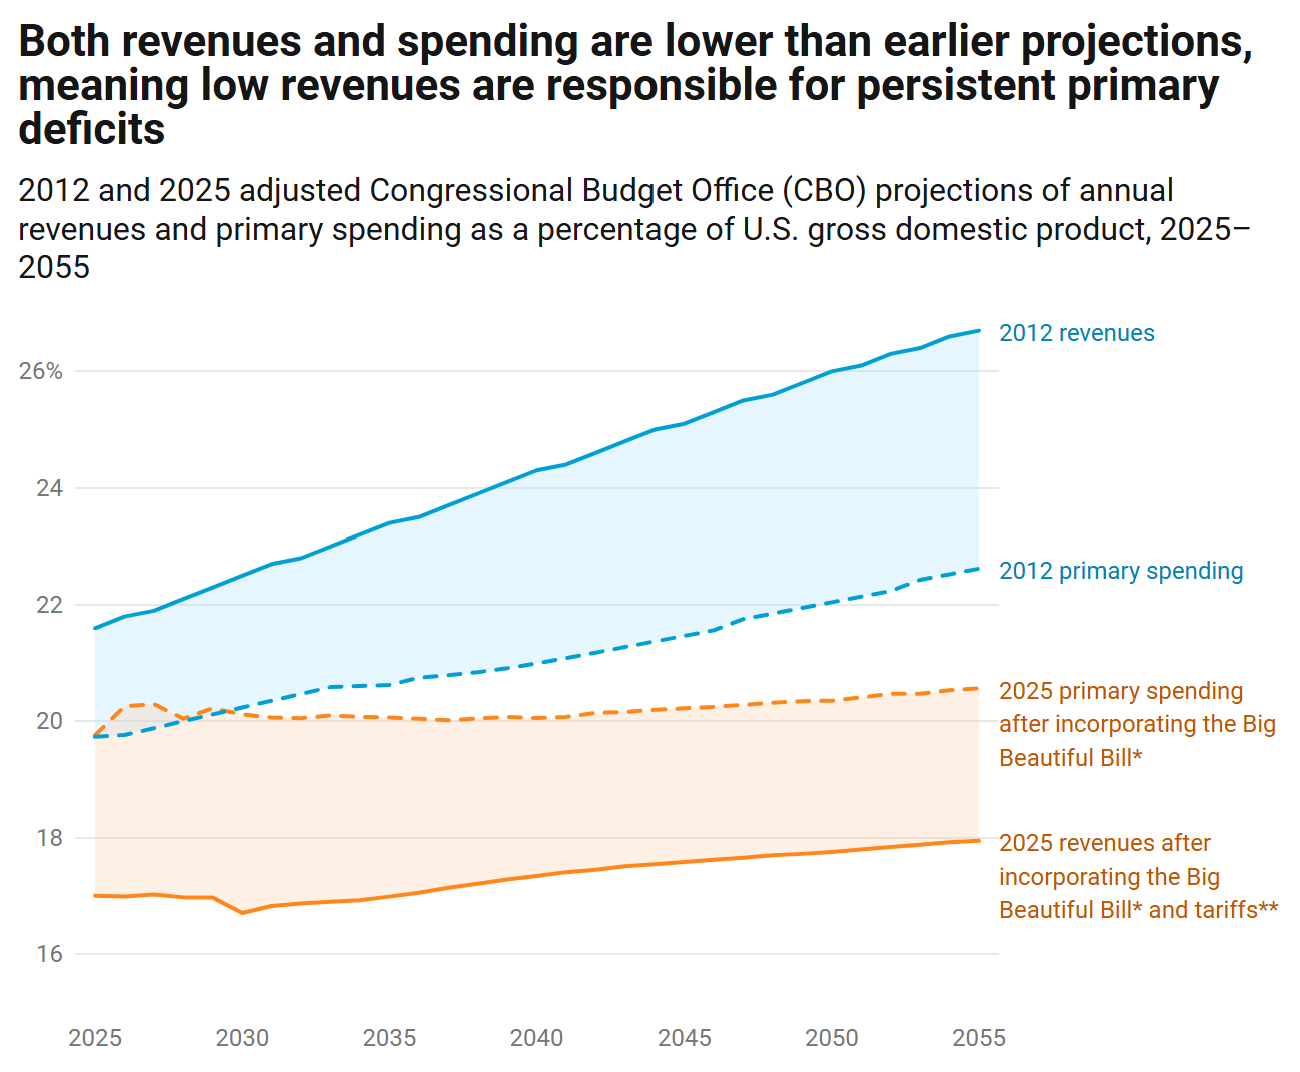
Back in 2012, primary spending was expected to go up from just under 20% of GDP to slightly over 22% (dotted blue line).1 Fast forward to today, and you see the expectation is for spending to end up about 2% of GDP lower than in the 2012 projection (dotted orange line).
Now, do the same exercise for revenues. Back in 2012, our revs outlook started out at just below 22% of GDP and ended up slightly north of 26% (solid blue line2). Compare that to the saggy orange solid line tracking today’s revs outlook, starting at about 17% of GDP and ending up at 18%. That’s a projected revs decline of almost 8 percentage points of GDP (26%-18%)!
That’s the analysis that leads us to conclude that our structural—a word we’ll get back to in a moment—problem stems from relentless tax cutting that has busted the linkage between economic growth, which has been good, and revenue flow to the US Treasury, which has been far too weak. It’s not just that the revenues losses fully explain the picture, but that when trying to explain what changes got us out of a long-term-stable tax and spending structure, spending projections are down, not up.
We’re clearly putting a lot of weight on this word “structural.” By this we mean “built into the long-term structure of our fiscal system.” The key reason we stress this is that if you have a structural imbalance between expected outlays and expected inflows (revs), then the ups-and-downs that you track in the Riedl-type figure are less informative, in a policy sense. We want to know: “how did we get out of balance relative to the prior, sustainable taxing/spending regime, one wherein we always knew spending was going to go up.” How could it be that spending took us out of balance relative to the prior structure when actual spending actually came in below the earlier projections?
Applying that logic to Ms. Rield’s figure above, note her 4.1% increase in “Social Security and Health Entitlements,” 2000-26, shown in the blue bar. Now, eyeball Figure 1 on page 3 from CBO’s 2000 Budget Outlook, pasted in below. We don’t have the underlying data in the figure so we had to do some drawing, but the expectation back in 2000 was that this spending would grow by a good bit more than 4 ppts of GDP. We saw this spending coming but back then we still had a tax system that could have handled it in a sustainable way. That’s what we mean by a structural imbalance born of relentless tax cuts.
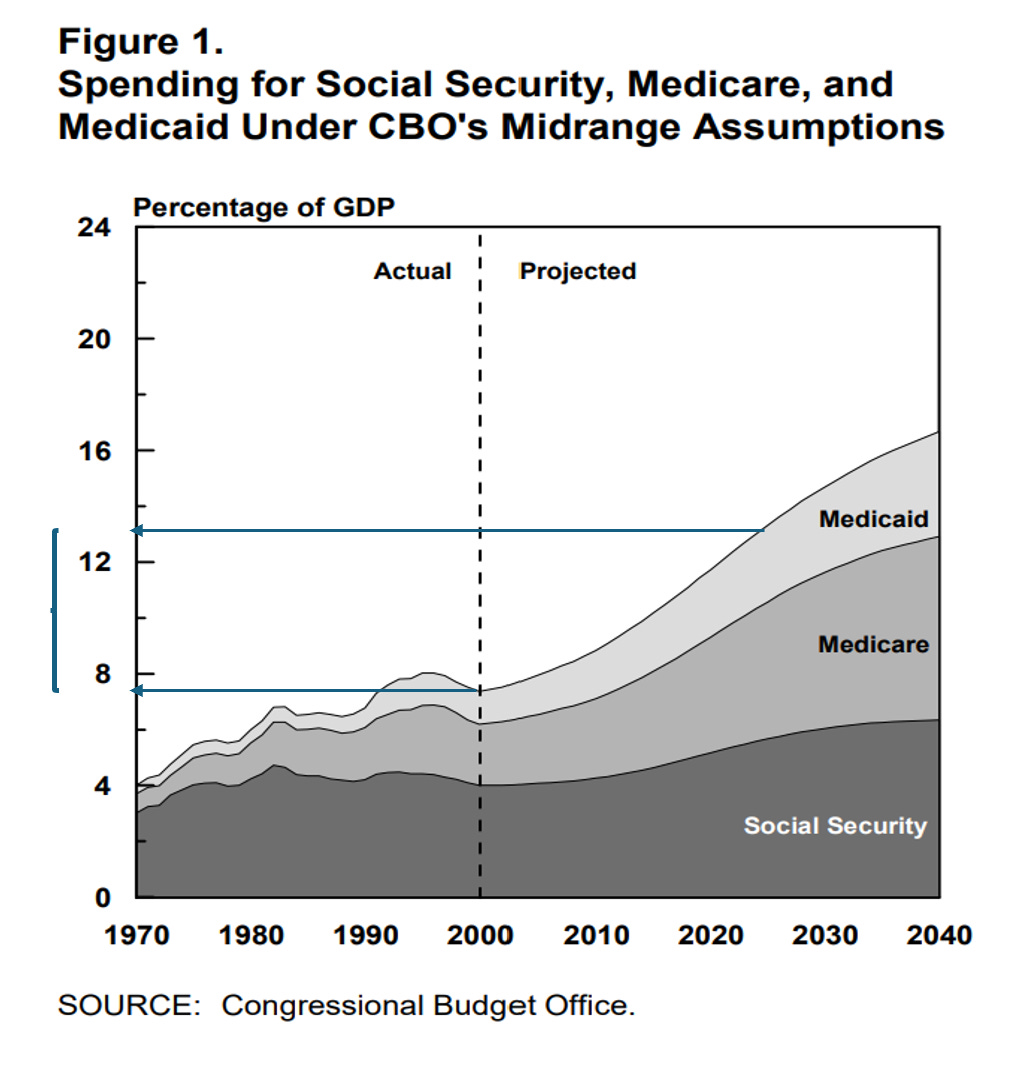
Yes, you could definitely argue, and many do, that we should cut Social Security and Medicare to solve our unsustainability problem. But those are policies that the vast majority of us have long agreed should be left largely intact. They’re very much embedded in both of our figures above, meaning that absent all this tax cutting, we could have sustained them without breaking a sweat. It was thoroughly understood that the retirement of Baby Boomers would lead to rising spending on Medicare and Social Security, but our results in the first figure above show that the old tax system generated sufficient revenues such that the government would nonetheless run primary surpluses, with debt/GDP declining indefinitely.
Let us try an analogy. Have you ever raised a puppy? Jared did (a golden retriever name Rocky, may he rest in peace after a good, long life), and every day Rocky ate more and grew such that he was bigger when Jared came home from work than when he left that morning. Anyway, in this analysis, that’s spending, which expectedly grew as Rocky grew.
Jared took him out each day for tons of exercise (that’s revenues), and Rocky grew into a happy, healthy, beloved friend.
Now, suppose Jared got lazy and cut down on his exercise time. He’d cut back on his feed to partially account for this change (these are the two dotted lines above), but not enough to offset the lost healthy impact of all that running around (which largely involved throwing a tennis ball and convincing Rocky that if he didn’t give the retrieved ball back, the game was over). As a result, even with reduced spending puppy-rations, the absence of revenues exercise, left him fat and sickly (to be clear, this was not the case with the actual Rocky).
Okay, we warned you that all this budget math would be gnarly, but at least we added a puppy.
So, yes, we think tax cuts are the far larger cause of our debt pressures, but that doesn’t mean we think spending is at some magical, optimal level or that cuts shouldn’t be on the table. Ms. Riedl herself has identified many such cuts that we’d support (and many we’d firmly oppose). Surely, in a political-negotiation sense, there’s no sustainability deal that doesn’t include both spending cuts and tax increases.
But our structural shortfall is not coming from the spending side of the budget. It’s from the revenue side and there’s simply no path to resolving this imbalance that does not largely rest on and respond to that fact.
Primary spending leaves out net interest payments because the target of the too-much-spending critique is policies which Congress can change, of which debt service is decidedly not one. Interest on the debt is a contract between the Treasury and those who lend to the US gov’t, and that contract cannot be repealed. Courts are very clear that the government is not free to renege on its contracts. Moreover, today’s debt is the sum of all deficits and surpluses since 1791, unlike today’s size of any spending program. Put another way, had it not been for all those tax cuts, the debt would now be far lower, which means interest costs would now be correspondingly lower.
Note that this doesn’t assume the Alternative Minimum Tax that was first indexed for inflation at Clinton levels; if you assumed that, it would instead grow from 20% to more than 23%, not materially changing the underlying point. Were that in the figure, the rev shortfall would be 5 ppts of GDP vs. the 8 we cite in the text.
Borrowing to invest in the future -- improving infrastructure, educating our children, improving healthcare, etc -- can make a lot of sense. Unfortunately, that's not what we're doing with the money we borrow.
Instead we're fighting a war that has no plan or purpose; we're spending money on extravagances in the White House; we're giving extraordinary tax gifts to corporations and the wealthy; we're building walls; we're going to spend billions to replace modern catapults on our aircraft carriers with old-fashioned ones that our dear leader likes better; we're planning to build Trump-class battleships that the military neither needs or wants; we spend money on no-compete contracts given to Trump's cronies; we're spending billions to stop windmill projects we desperately need; etc, etc. ...
Back in the 80s, the Democratic Congress, led by Tip O'Neil, and President Reagan recognized that, when boomers retired, there would be a shortfall because taxes dedicated to Social Security coming in would be less than payments going out to retired Americans. So they raised the Social Security tax (FICA). Since the amount coming in then exceeded the amount going out, the money was supposed to be set aside to cover the shortfalls coming up in 30 years or so. Instead, the extra money was spent and used to cover the subsequent tax cuts. This was the famous "lock box" debate between GW Bush and Al Gore in 2000, for which Gore was ridiculed on SNL and elsewhere. So, Bush won, the money wasn't put in the "lock box" and now the bill has come due. And, naturally, Republicans don't want to pay it