


The U.S. Job Market Just Keeps on Truckin'
At least for now, March delivers another solid jobs report.


What a difference a day makes. Wednesday was Liberation Day, Thursday was Liquidation Day, and today is jobs day for March, and a good one at that. It doesn’t mean that the tariff and DOGE disruptions won’t, at some point, hurt the broader labor market. But they haven’t done so yet.
Payrolls were up 228,000, well above expectations for 140,000. Downward revisions for Jan/Feb lowered payrolls by 48,000 but the 3-month average of monthly gains for Q1 came in at 152,000, a pace that’s comfortably above “breakeven,” meaning the number of added jobs needed to keep the unemployment rate from climbing.
Unemployment did tick up a tenth to 4.2%, but for a good reason: more labor force participation. The participation rate ticked up a tenth as well, as 230K more folks joined the March labor force. The closely watched prime-age labor force participation rate fell, from 83.5% to 83.3%. But those numbers bop around from month-to-month and that’s still a healthy participation rate.
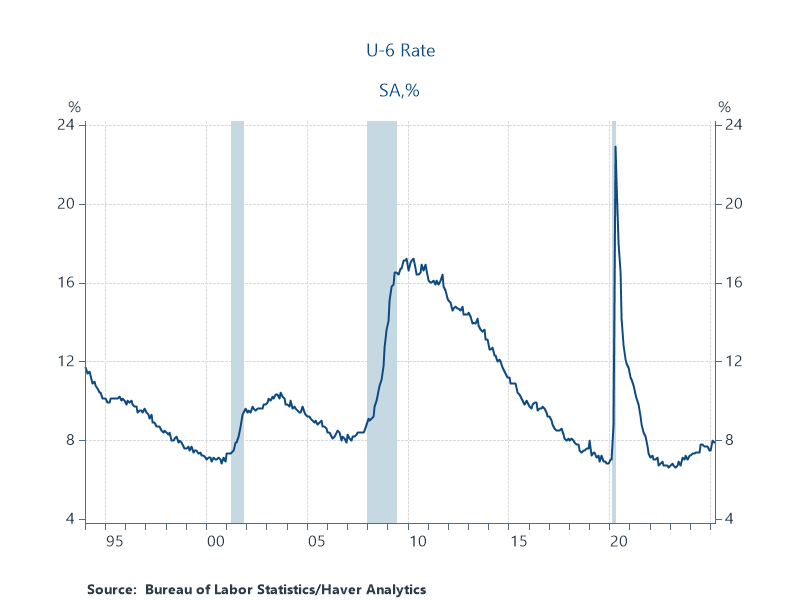
Last month I reported a concerning bump up in the so-called “U-6” rate, the most comprehensive measure of labor market slack, including workers who can’t find the hours they seek (“involuntary part-timers”). The rate ticked down slightly in March, from 8% to 7.9%, but it’s still about a point higher than its lows in the first half of ‘23.
In other words, the U.S. job market has cooled, but from red-hot to sustainably warm. Payroll gains are in a safe-zone (above breakeven), unemployment remains low, and wage growth, up 3.8% for private-sector workers, continues to beat inflation, which was 2.8% in February (we’ll need to wait a few weeks for March inflation data, where we could see some early tariff pressures).
That 3.8% for wage growth is down from 4% last month; for middle- and lower-wage workers, the pace was 3.9%, also a tick down from Feb, but still well ahead of prices. These real gains should continue to support consumer spending, as they have for a few years now.
Federal government employment is still not showing much in terms of layoffs. It was down 4,000 last month, but its level—3 million—is the same as a year ago. Manufacturing employment was soft, up 1,000; construction was a bit firmer, up 13,000. Retail trade got a nice pop, up 24,000, and transportation/warehousing rose 23,000. Health care had another strong month, up 54,000. (To be clear, I object to recent shade-throwing at this sector! These are important private-sector jobs in one of our most robust industries; yes, the government is a big consumer of health care, but so what? Labor demand is labor demand; jobs are jobs! If you want to get wound up about the sector, worry about the job quality—not the quantity—of lower-paid health workers, like home health aids.)
In sum, if you were worrying, and I know many, myself included, very understandably were, about the impact of Trump’s tariffs and the DOGE on the reliably solid U.S. job market, which has long been at the core of this ongoing expansion, you can breath easier re the labor market in March. Of course, the “Liberation Day” tariffs are just now coming on line, and the cases of government workers are still in the courts, where many have had their jobs restored.
It is very likely that if Trump does not stand down, and all signs suggest he’s deeply dug in, future jobs reports will show more negative impacts of his agenda. And, of course, I’ll be closely watching upcoming inflation reports for tariff-induced cost pressures. But for now, I’m relieved to report that the U.S. job market remains in good shape.
Has anyone added the tariffs to their bottom up equity models to see how this impacts corporate profits?
I put together a rough and dirty and I hope the tariffs raise lots of fees, cuz I don't see much corporate profits to tax (or justify even the currently reduced equity market levels) anytime soon
“What a difference a day makes?”
OK. Maybe.
But, honestly, I don’t understand what difference the reported tiny statistical variations make. For example, “prime-age labor force participation rate fell, from 83.5% to 83.3%.” And, “U-6…ticked down slightly in March, from 8% to 7.9%.” Etc.
How can we understand their implications without knowing the margin of error and the inherent variability?
Thanks