
There are a lot of numbers out there on the big, bad budget bill
Here are a few important ones.

From what I can tell, most of my readers don’t require excessive number crunching to take an informed stand on why the big budget bill is so…I was going to say “problematic” but that’s way too tame…offensive.
As it stands—the Senate continues to squabble over the House bill—the bill is especially egregious in that while past such Republican proposals cut taxes for everyone, just way less at the bottom/middle than at the top (in part, because low-income households tend not to owe federal taxes), this one explicitly and deeply cuts health and nutritional supports that some low-income households do receive to partially offset the cost of tax cuts for the wealthy.
There are reams of smart analyses of the bill’s prospective impact on health and SNAP (food support) coverage, deficits, after-tax income impacts, but here’s a quick look at some of the numbers I’ve found most striking. Feel free to add others you think we should see in the comments. Links to each entry are stacked below.
Total tax cuts for the richest 5%: $1.6 trillion
Total spending cuts to SNAP and Medicaid: $1.3 trillion
Increase in the deficit over a decade: $2.4 trillion
Increase in the deficit plus added interest payments: $2.9 trillion
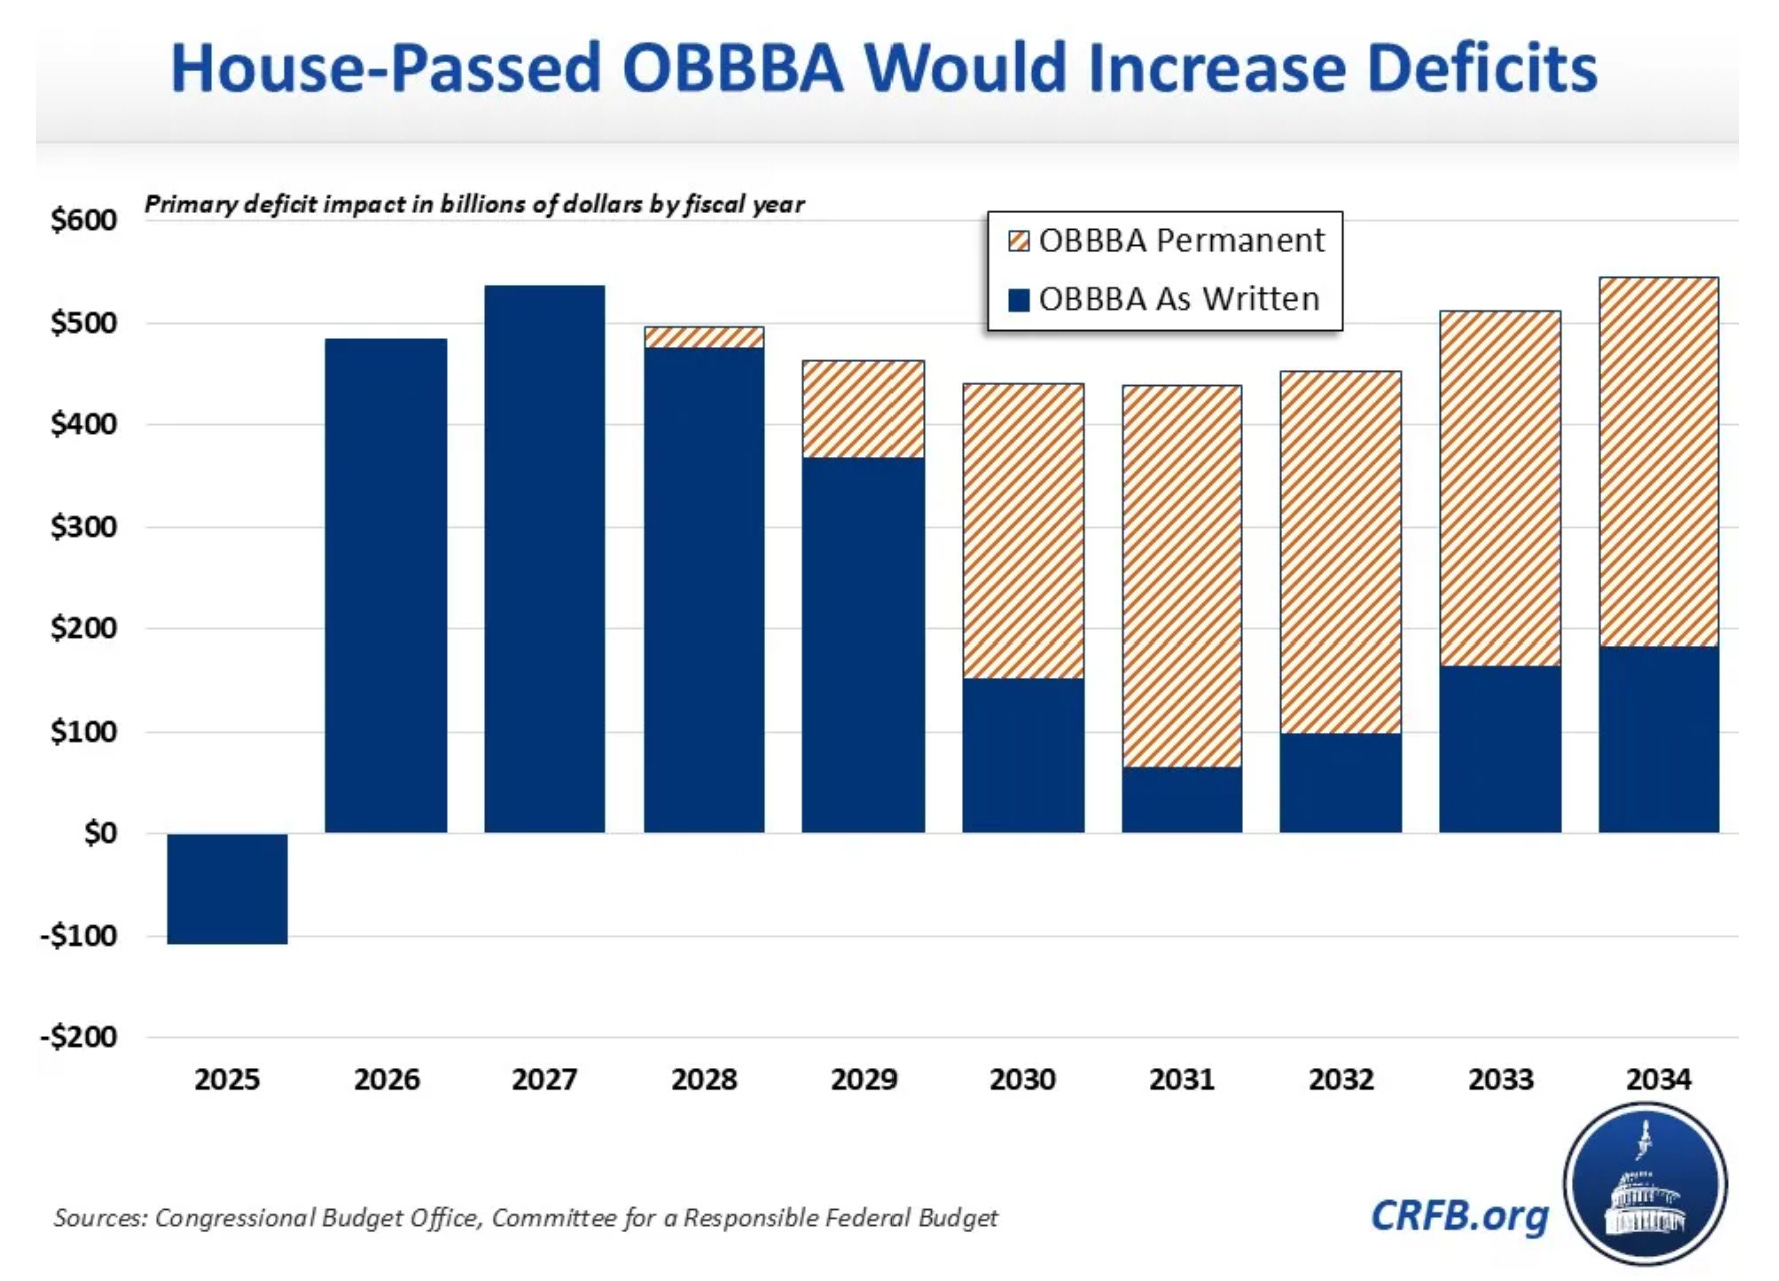
And the correct number, im(not so)ho, assuming baloney tax-cut sunsets are extended: $5 trillion
[Quick ventilating comment: What kind of idiots do they think we are? The whole point of this monstrosity is to extend the highly skewed tax cuts from Trump 1 that had a phony sunset to make the numbers work. They’re doing the same thing here. This slide from CRFB shows the significant difference.]
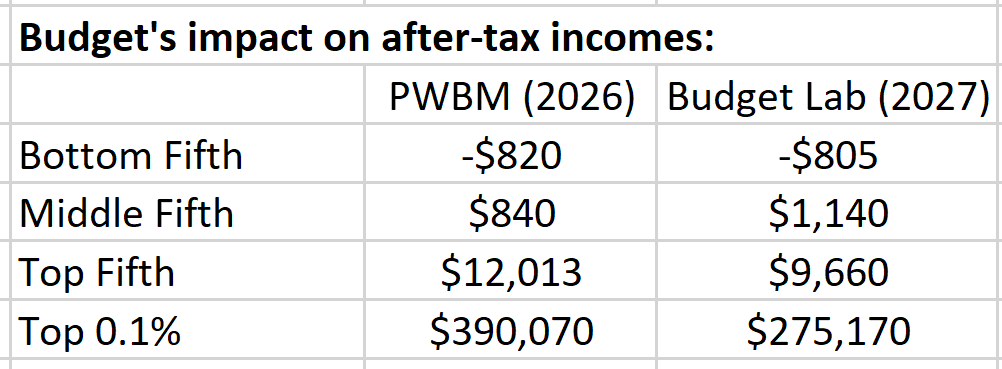
Who wins, who loses?: Estimates vary in magnitude but not in sign. That is, the bottom loses income; the middle on up gains income but the big winnings are predictably at the top. Here are estimates from the Penn Wharton Budget Model and the Yale Budget Lab (links below).
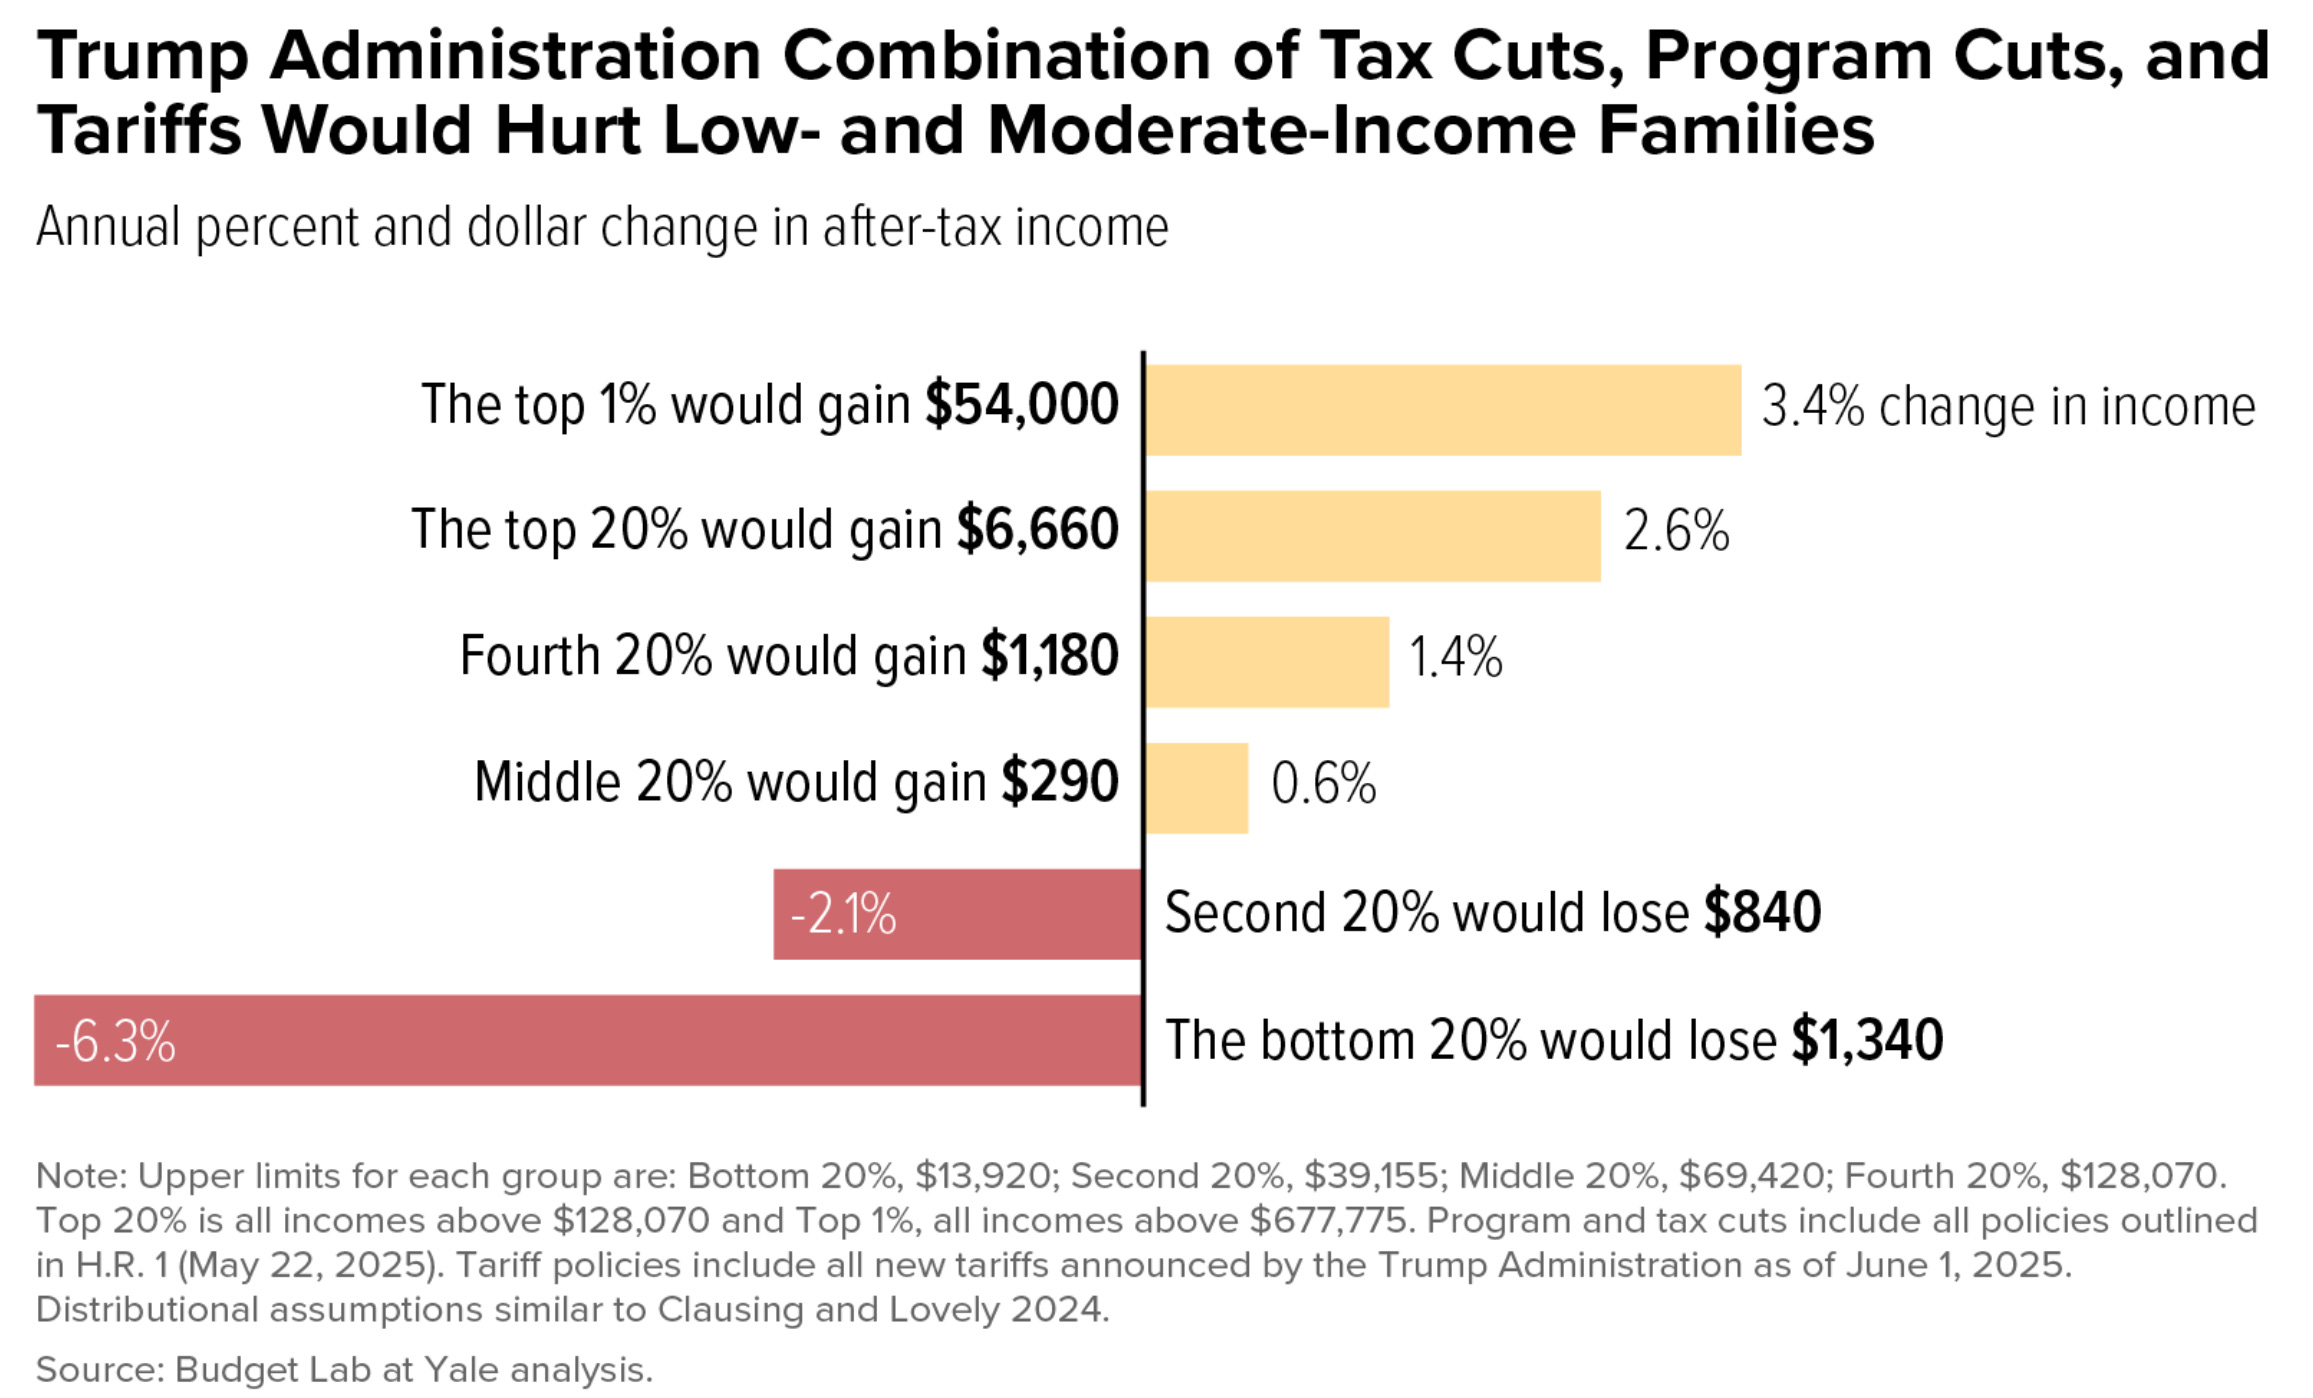
Neither estimate includes tariffs, which, as with any regressive tax, hit the bottom and middle (as their consumption basket includes more imports) more than the top. The Center of Budget and Policy Priorities usefully adds tariffs to the mix, leading to larger losses at the bottom and smaller gains at the middle.
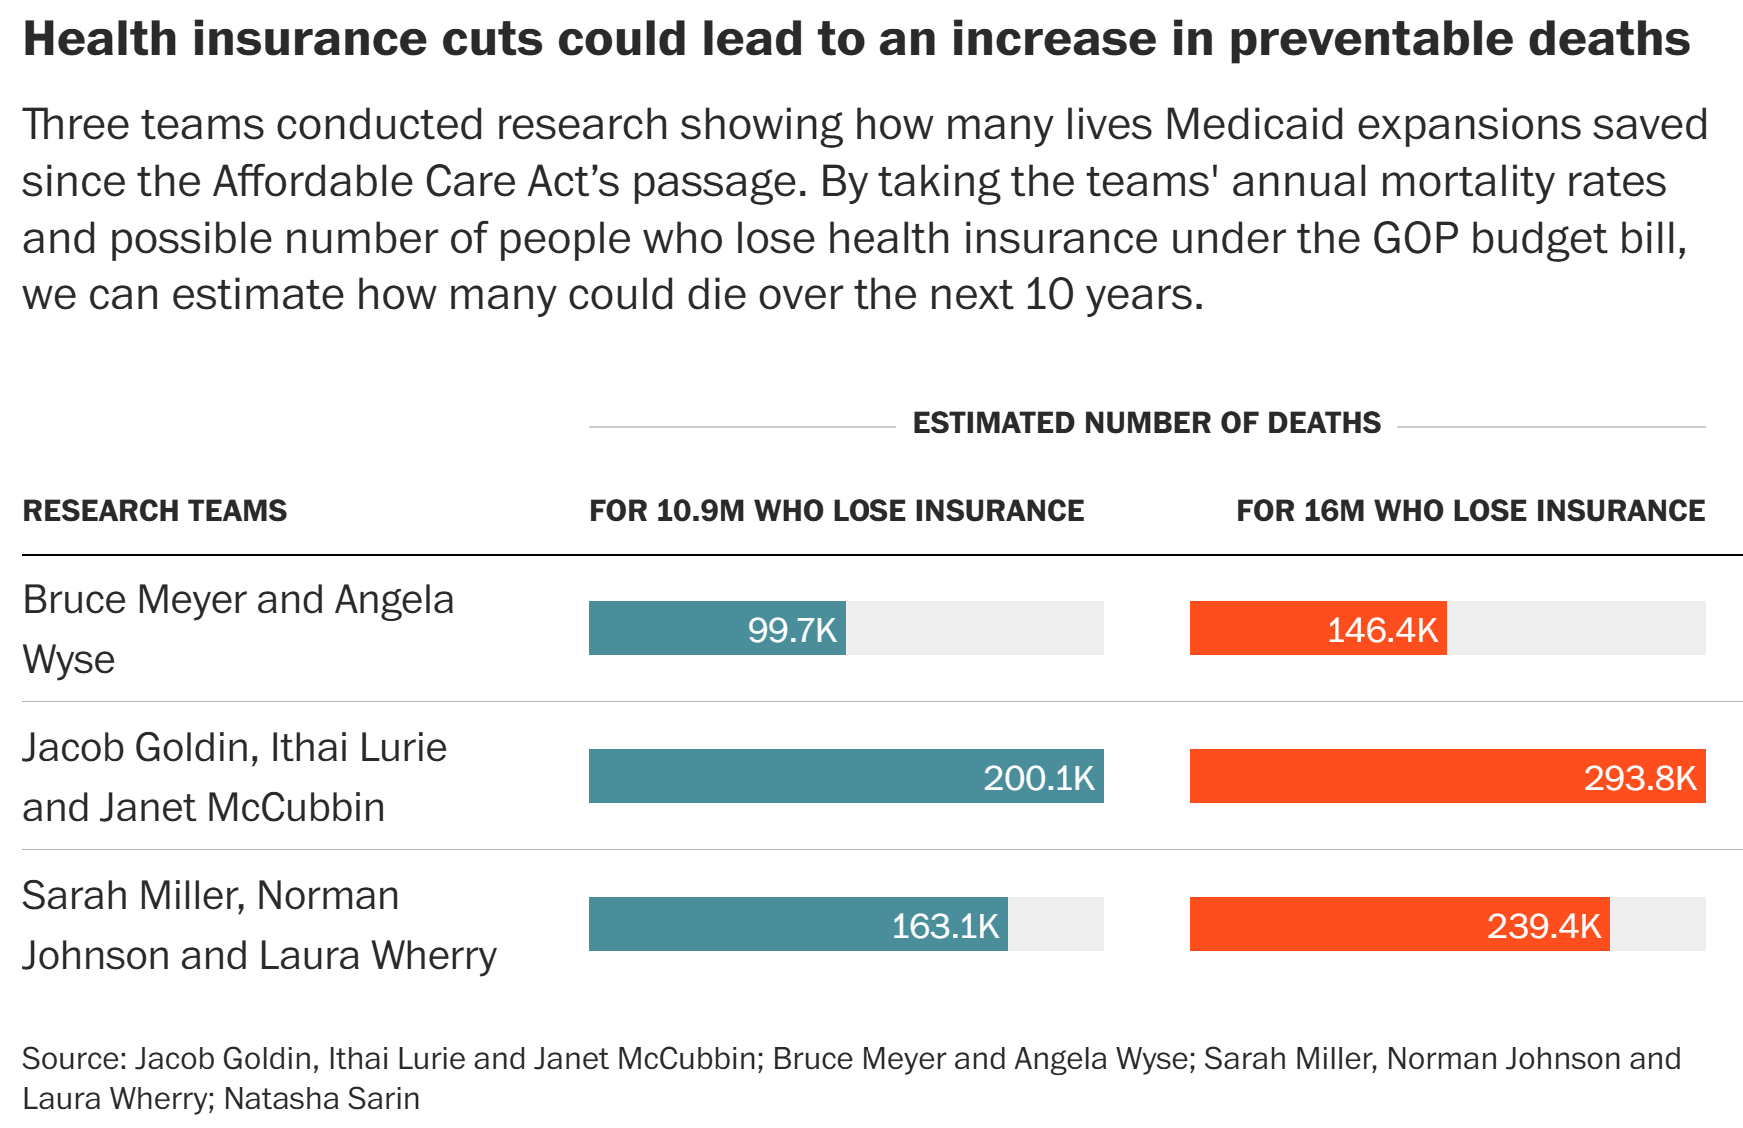
Number of people expected to lose health coverage due to Medicaid Cuts and Obamacare tax-credit cuts: 16 million
Number of early deaths that is expected to cause: around 100,000 over the next decade, and that’s a conservative [sic] estimate.
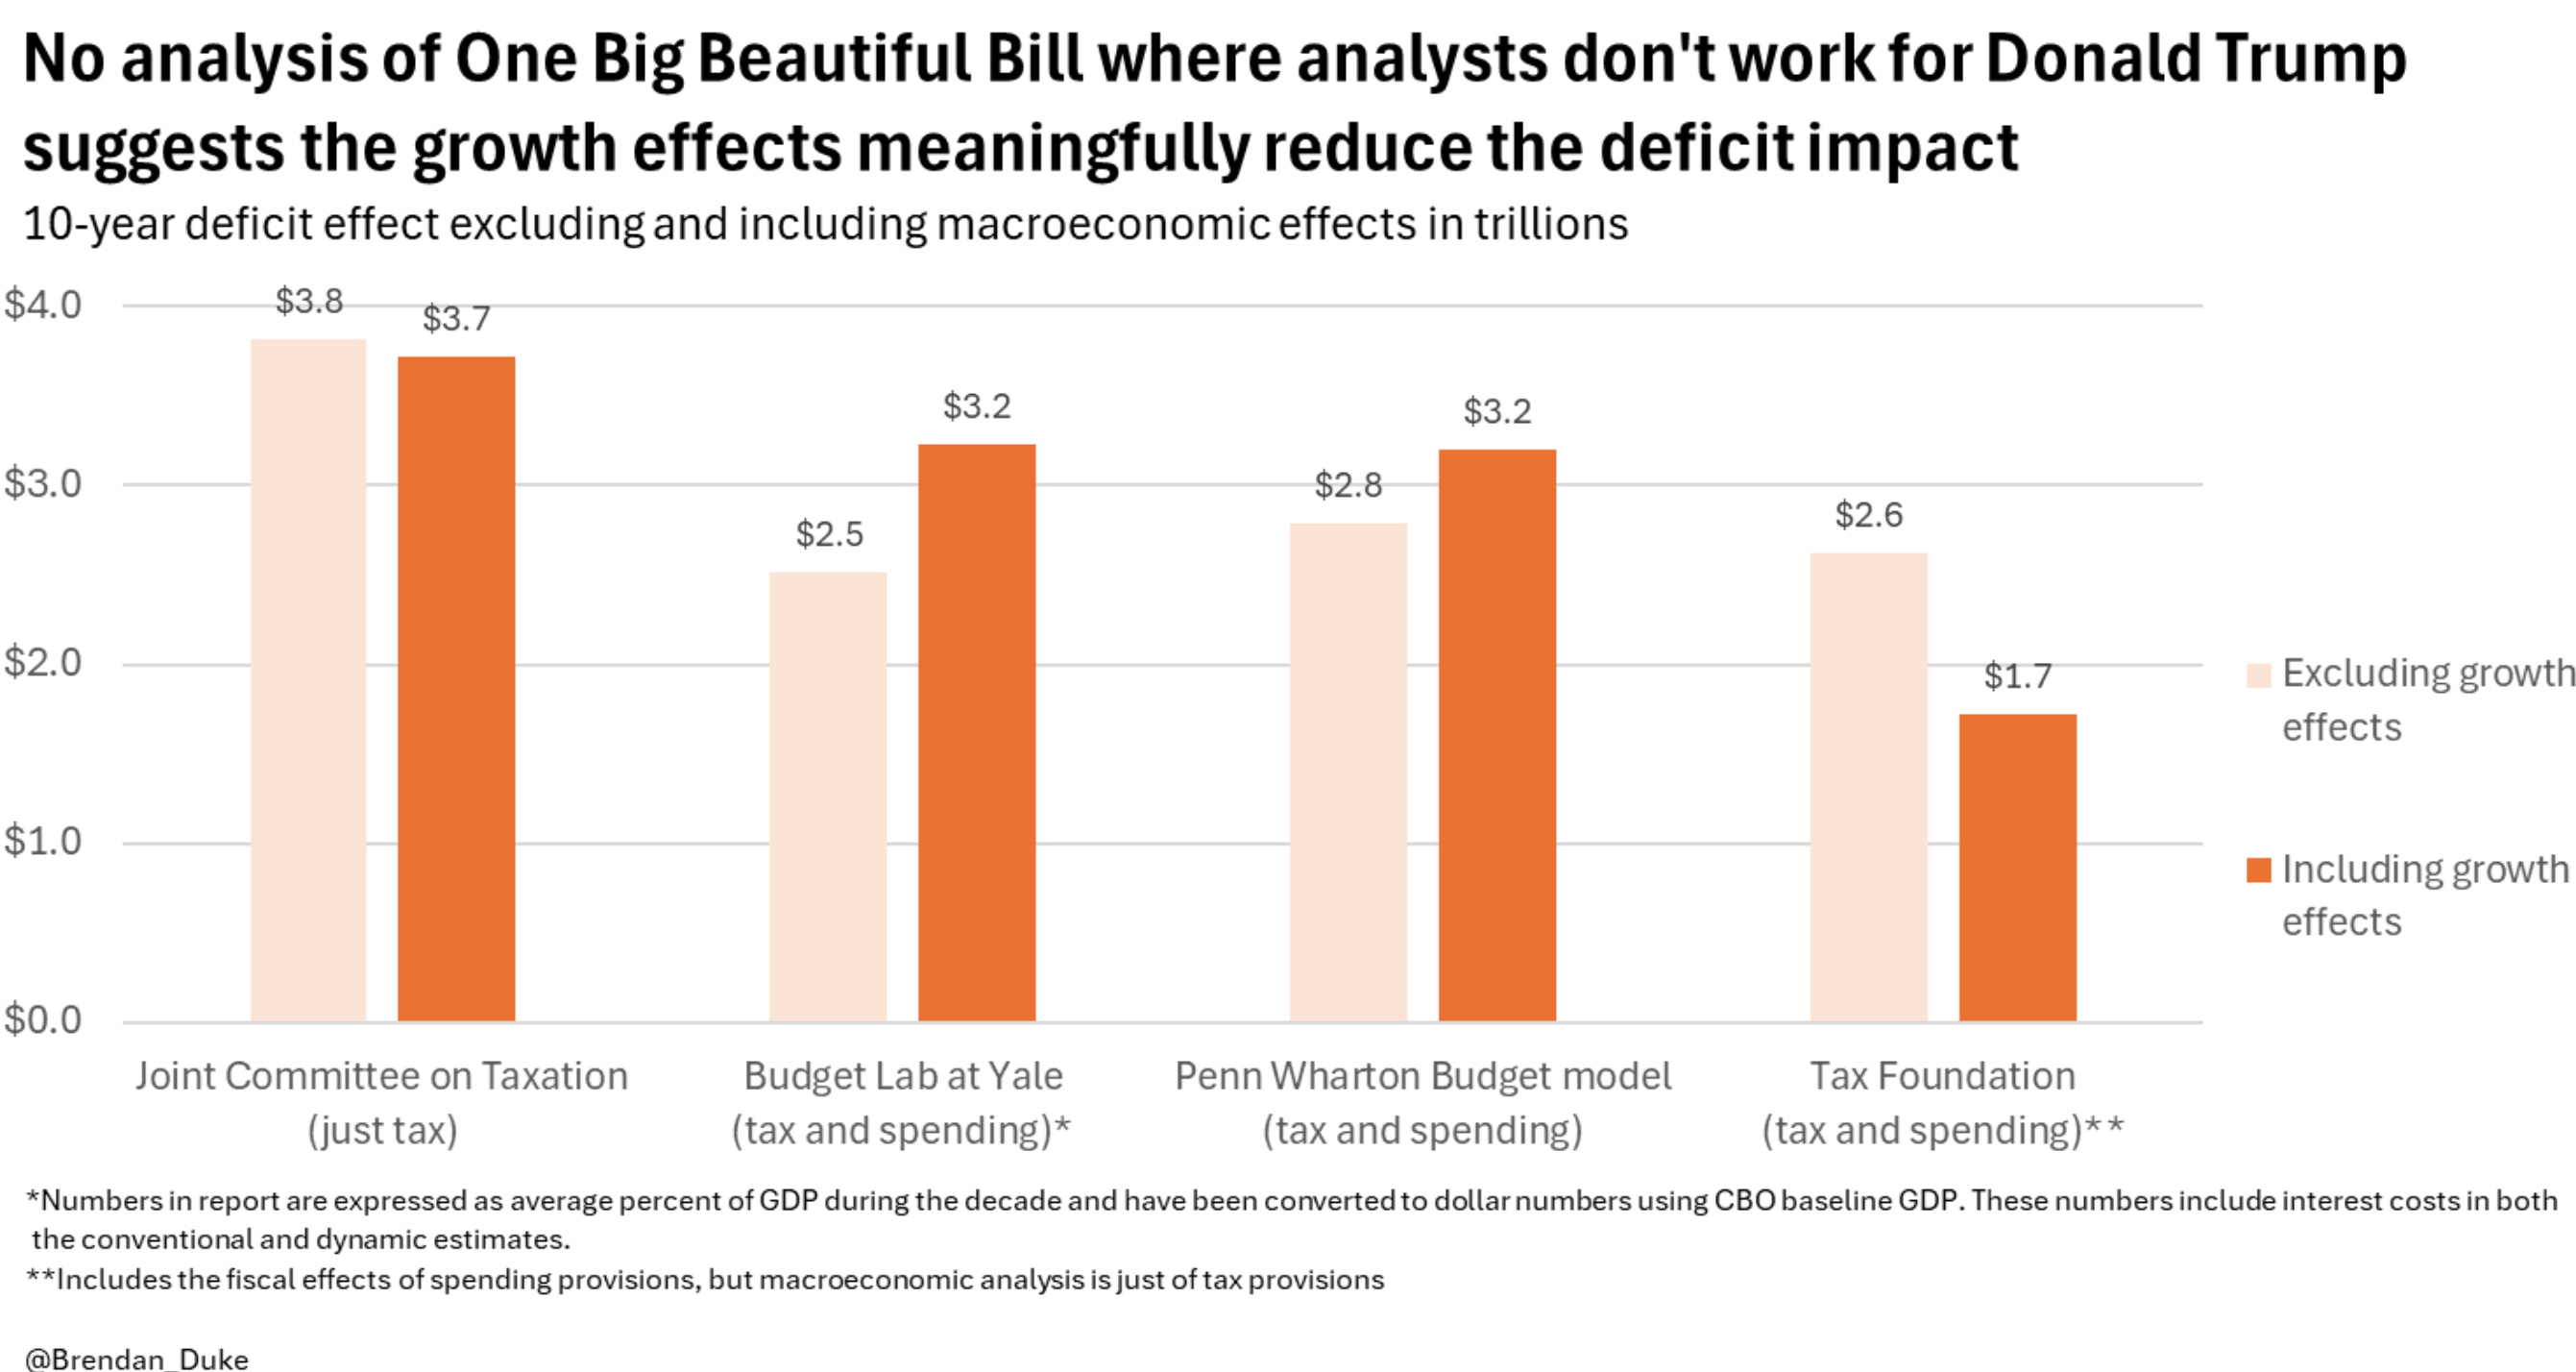
Growth impacts: This is just in here to warn you off, not that you need such a warning, Republican claims that the growth impacts of the bill will unleash a gusher of revenues to the U.S. Treasury. There is, of course, no evidence to support such a claim; this WSJ article has the receipts.
The estimates cited range from boosting long-term GDP from essentially zero to less than a percent. Here’s one from a bipartisan group with long experience in this space, finding a growth boost of 0.03%, which I will safely and comfortably call…zero (my bold):
Joint Committee on Taxation: The nonpartisan congressional scorekeeper projected that the bill’s tax components would produce short-run growth through increased labor supply and capital stock. That would be counteracted by rising budget deficits, with a net effect of taking 1.83% annual growth to 1.86%. JCT estimates that the bill’s tax provisions would cover less than 3% of their costs with revenue from economic growth.
A few analyses find that growth effects make the deficit even worse, presumably because the budget’s deficits will push up interest rates, which slows investment and growth.
To be clear, these false trickle-down claims are by no means new. It was back in 1516 when Thomas More observed, "Everywhere do I perceive a certain conspiracy of rich men seeking their own advantage under the name and pretext of the commonwealth."
I could go on but other assignments beckon. This is, of course, a small sample of what’s out there. Like I said, it will be useful for those following this budget to share in comments numbers, figures, and facts they come upon as this beast morphs into whatever it is to become.
Links:
https://x.com/Brendan_Duke/status/1931709814331031615
https://www.crfb.org/blogs/cbo-estimates-3-trillion-debt-house-passed-obbba
https://www.washingtonpost.com/opinions/2025/06/09/medicaid-budget-bill-deaths-trump/
https://budgetlab.yale.edu/research/distributional-effects-selected-provisions-house-reconciliation-bill-preliminary
https://budgetmodel.wharton.upenn.edu/issues/2025/5/23/house-reconciliation-bill-budget-economic-and-distributional-effects-may-22-2025
https://www.cbpp.org/charts/trump-administration-combination-of-tax-cuts-program-cuts-and-tariffs-would-hurt-low-and-0
https://x.com/Brendan_Duke/status/1932105071636197853
I do like these columns since I minored in economics in college, but one of the issues with very large numbers is that they do not translate to the lives of typical Americans.
Can we translate these figures into what they might do?
-- How will the lowest income families see their food budget cut on a weekly basis?
--If a family member loses Medicaid coverage, what is the likely cost of an emergency room visit for them?
We need these tangible forms of information to help everyone understand how our lives will be affected.
" .... why the big budget bill is so…I was going to say “problematic” but that’s way too tame…offensive."
I will settle for 'disgusting abomination.'